Morris & McDaniel
Marketing Report – Sept. 16 – Sept. 30, 2024
Website Traffic and CTA Results
Sessions – 4.1K (+10.87%)
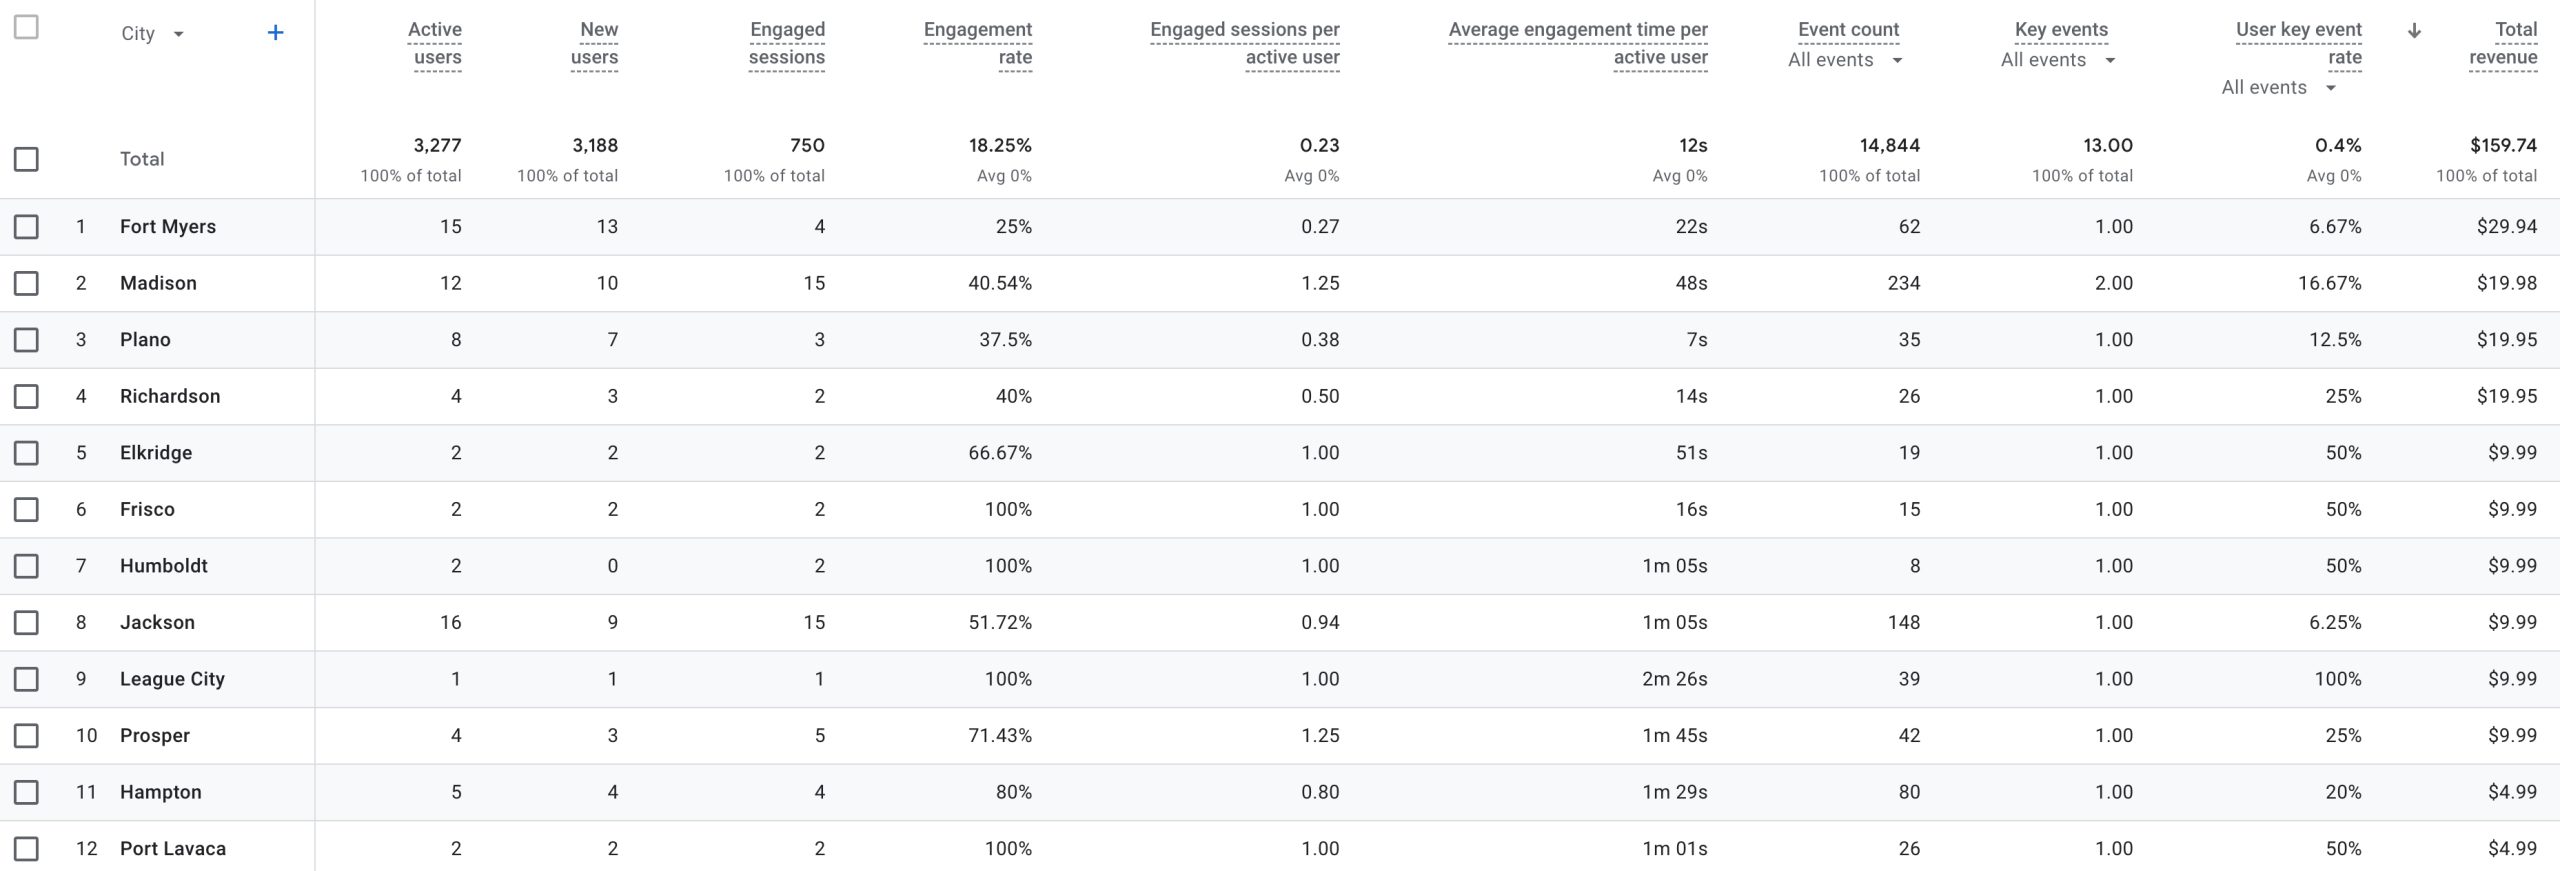
Conversions (sales) – 13, $159.74 (-57%)
Converstions (forms) – 69 (+25)
Overall Conversion Rate – 2% (+0.49%)
Previous Period - Sept. 1 - 15, 2204
Sessions – 3.7K
Conversions (sales) – 12 ($372.55)
Converstions (forms) – 44
Overall Conversion Rate – 1.51%
To establish a baseline for performance expectations, we researched how a $3,000 monthly marketing budget typically performs in the public safety sector. This is informed by industry benchmarks and the data we can currently gather from research and our campaigns.
Estimated Website Visits: 1,000 – 3,000
Average Website Conversion Rate – 2 – 3%
B2B Public Safety Departments:
-
- Form Submissions: 10-20
- Sales: 1-2 sales for the Turnkey Product
(the sales cycle being 1 – 6 month on average)
B2C Candidates (Practice Materials):
-
- Sales: 20-45 sales
- Revenue: $600 to $1,125
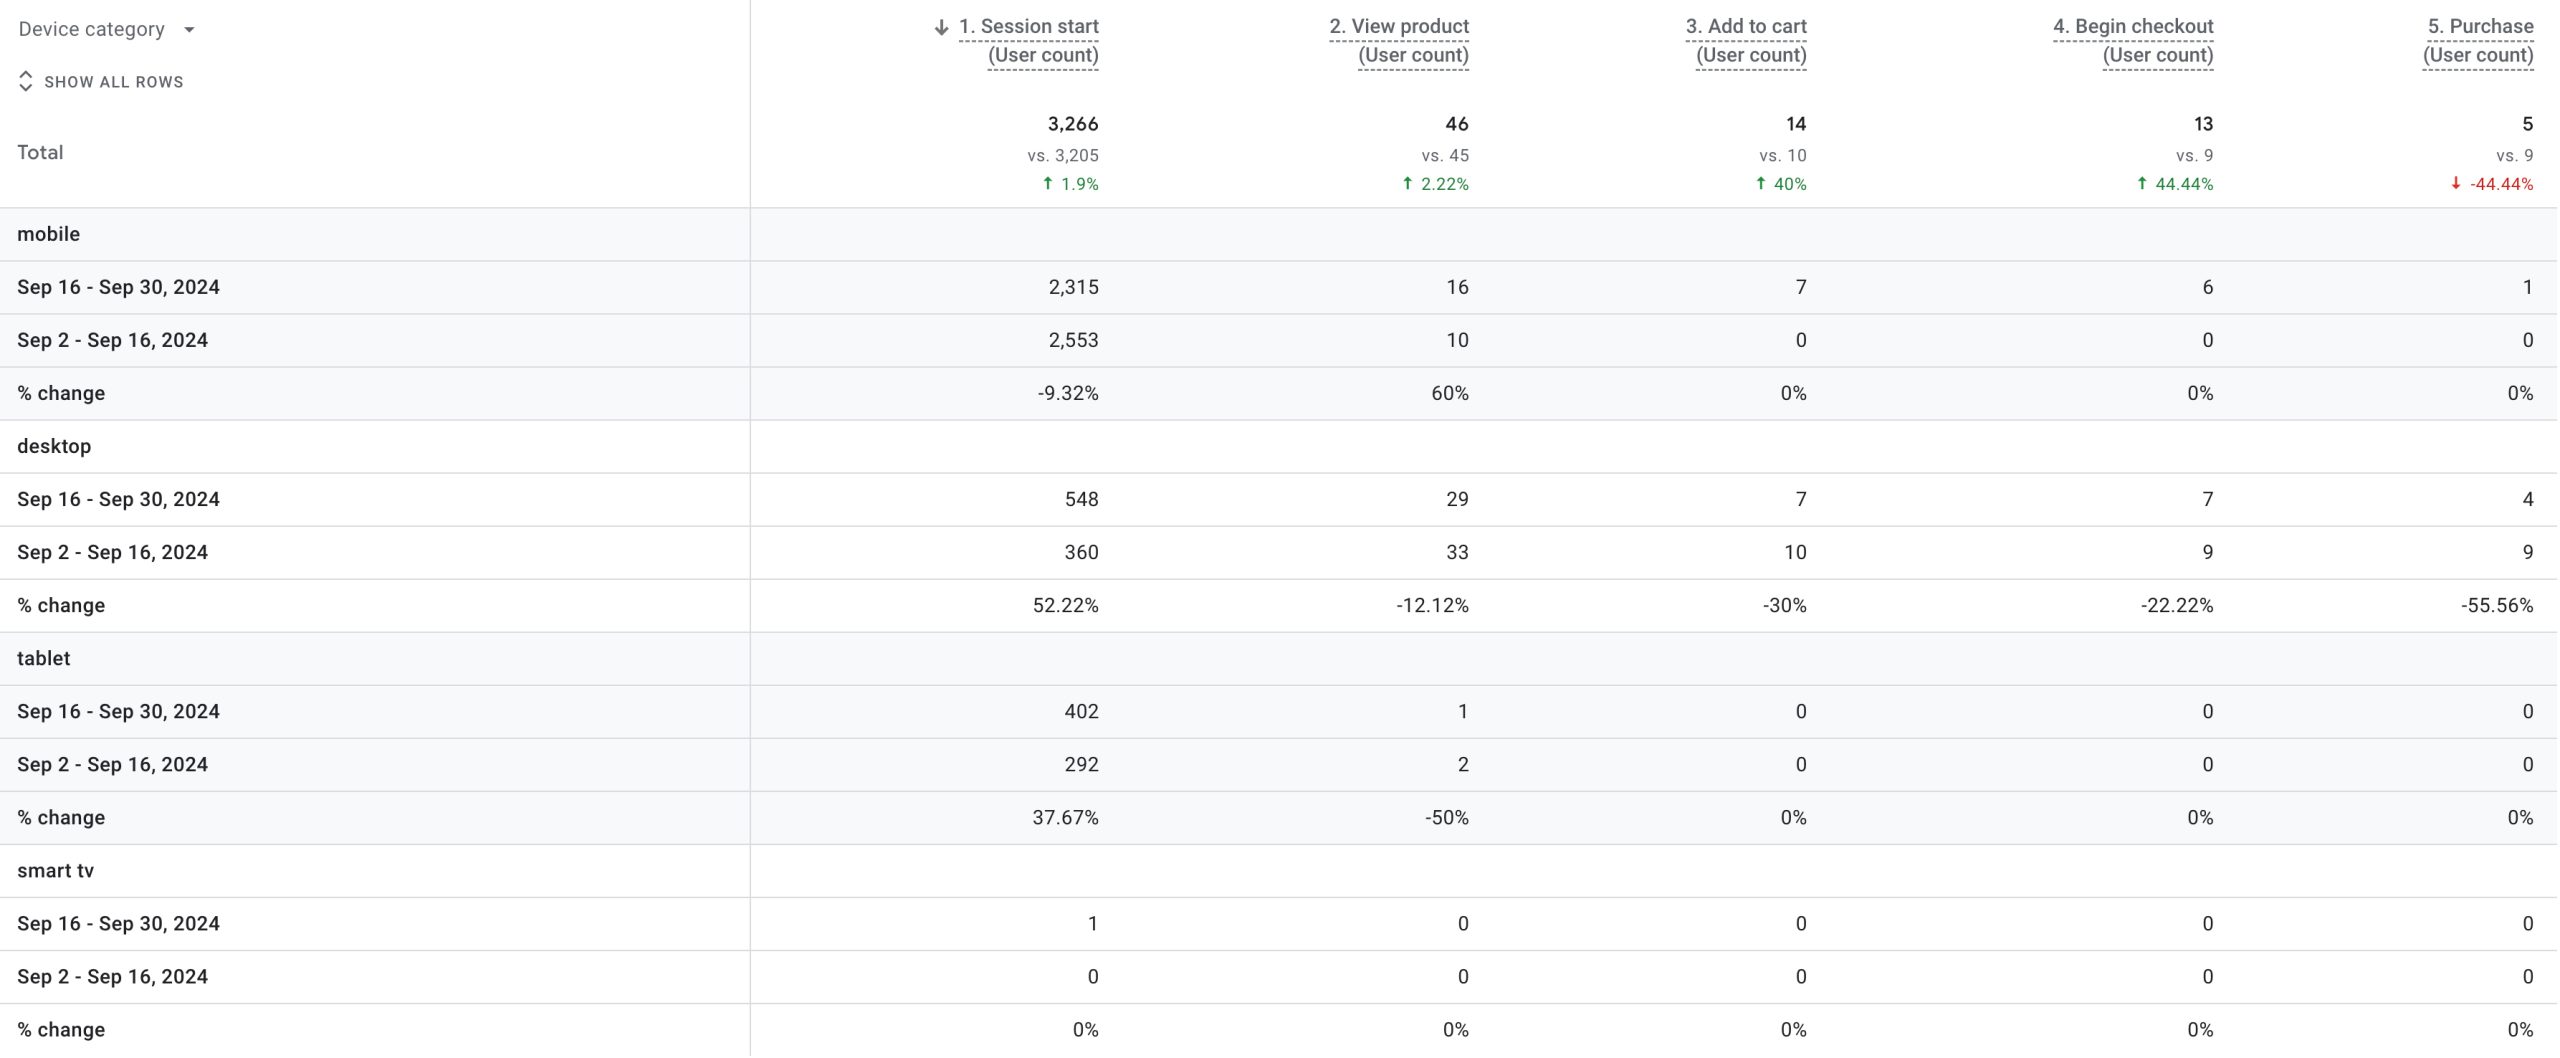
Product Abandonment Rate – 78%
Cart Abandonment Rate – 36%
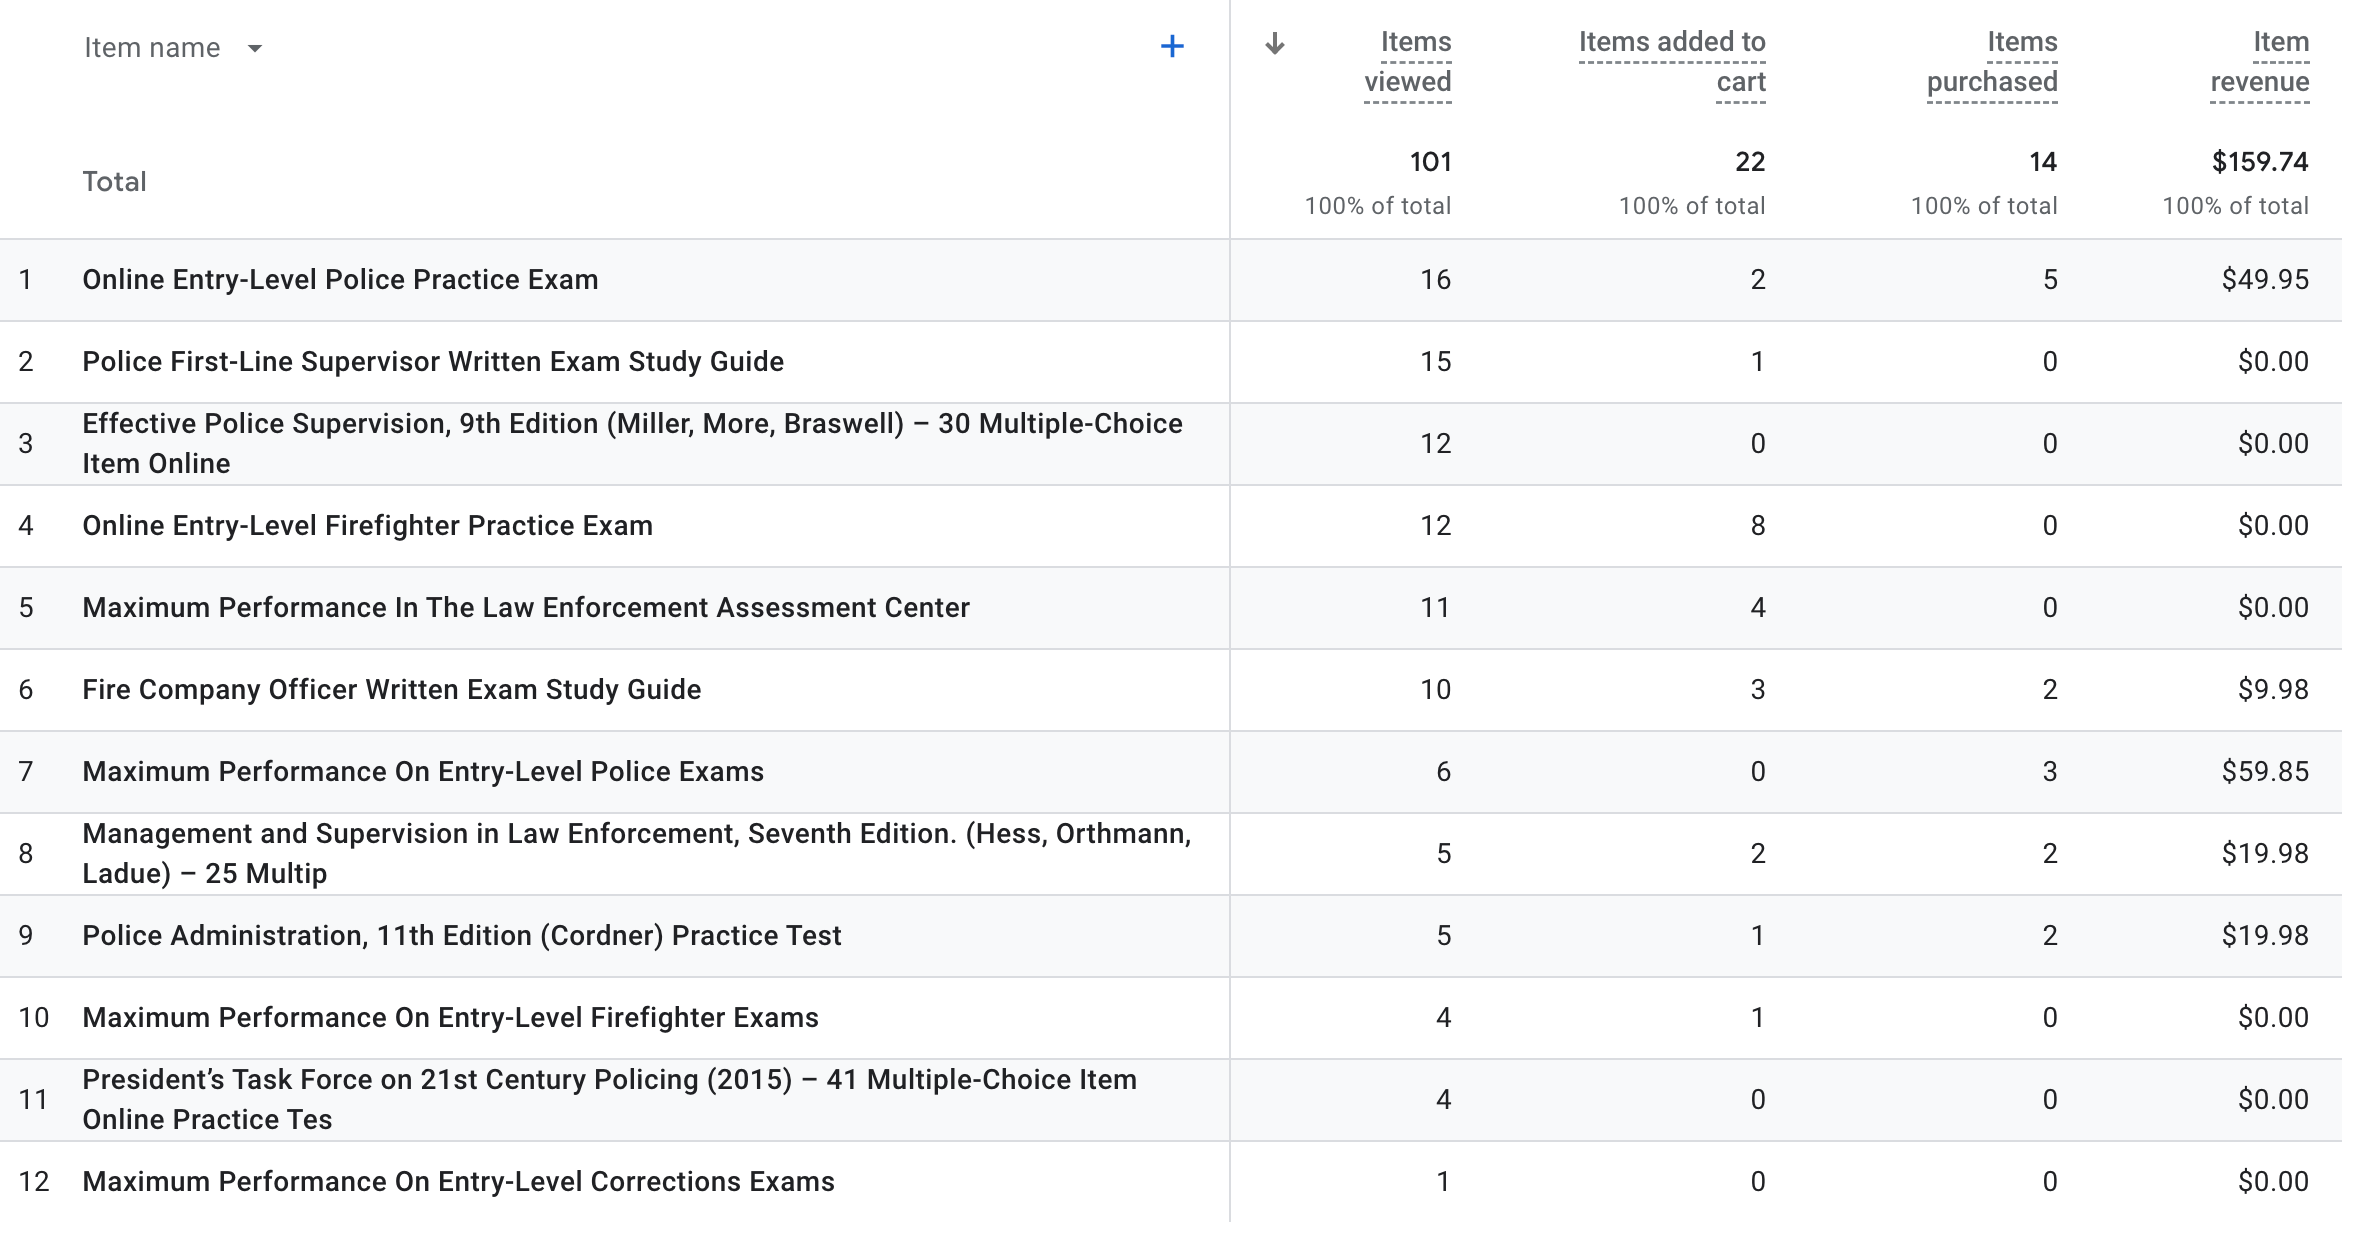
Purchased from Buy Button within WordPress: 3
Purchased from Shopify: 10
(out of 13 Total Sales)
Average Product Abandonment Rate: 65 – 80%
(where a visitor views a product but decides not to take the next step of adding it to their cart.)
Cart Abandonment Rate: 70%
(where a visitor views a product but decides not to take the next step of adding it to their cart.)
Previous Period - Sept. 1 - 15, 2024
Product Abandonment Rate – 82%
Cart Abandonment Rate – 37%
Purchased from Buy Button within WordPress: 5
Purchased from Shopify: 12
(out of 17 Total Sales)
Impressions – 48.7K
Link Clicks – 802
CTR – 1.65%
Average CTR for LinkedIn – 0.39% and 0.65%
Previous Period - Sept. 1 - 15
Impressions – 180
Link Clicks – 5
CTR – 2.78
Impressions – 87.1K
Link Clicks – 1.8K
CTR – 2.14%
Average CTR for Facebook – 0.90% to 1.61%.
Previous Period - Sept. 1 - 15
Impressions – 155.2K
Link Clicks – 3.5K
CTR – 2.26%
Impressions – 1.8K
Link Clicks – 55
CTR – 3.06%
Average CTR for Instagram – 0.22% to 0.88%.
Previous Period - Sept. 1 - 15
Impressions – 5K
Link Clicks – 81
CTR – 1.62%
Google Ads
377 website visitors
Previous Period - Sept. 1 - 15
177 Website Visitors
Average Email Open Rate – 21- 41%.
Average Email CTR – 2-3%.
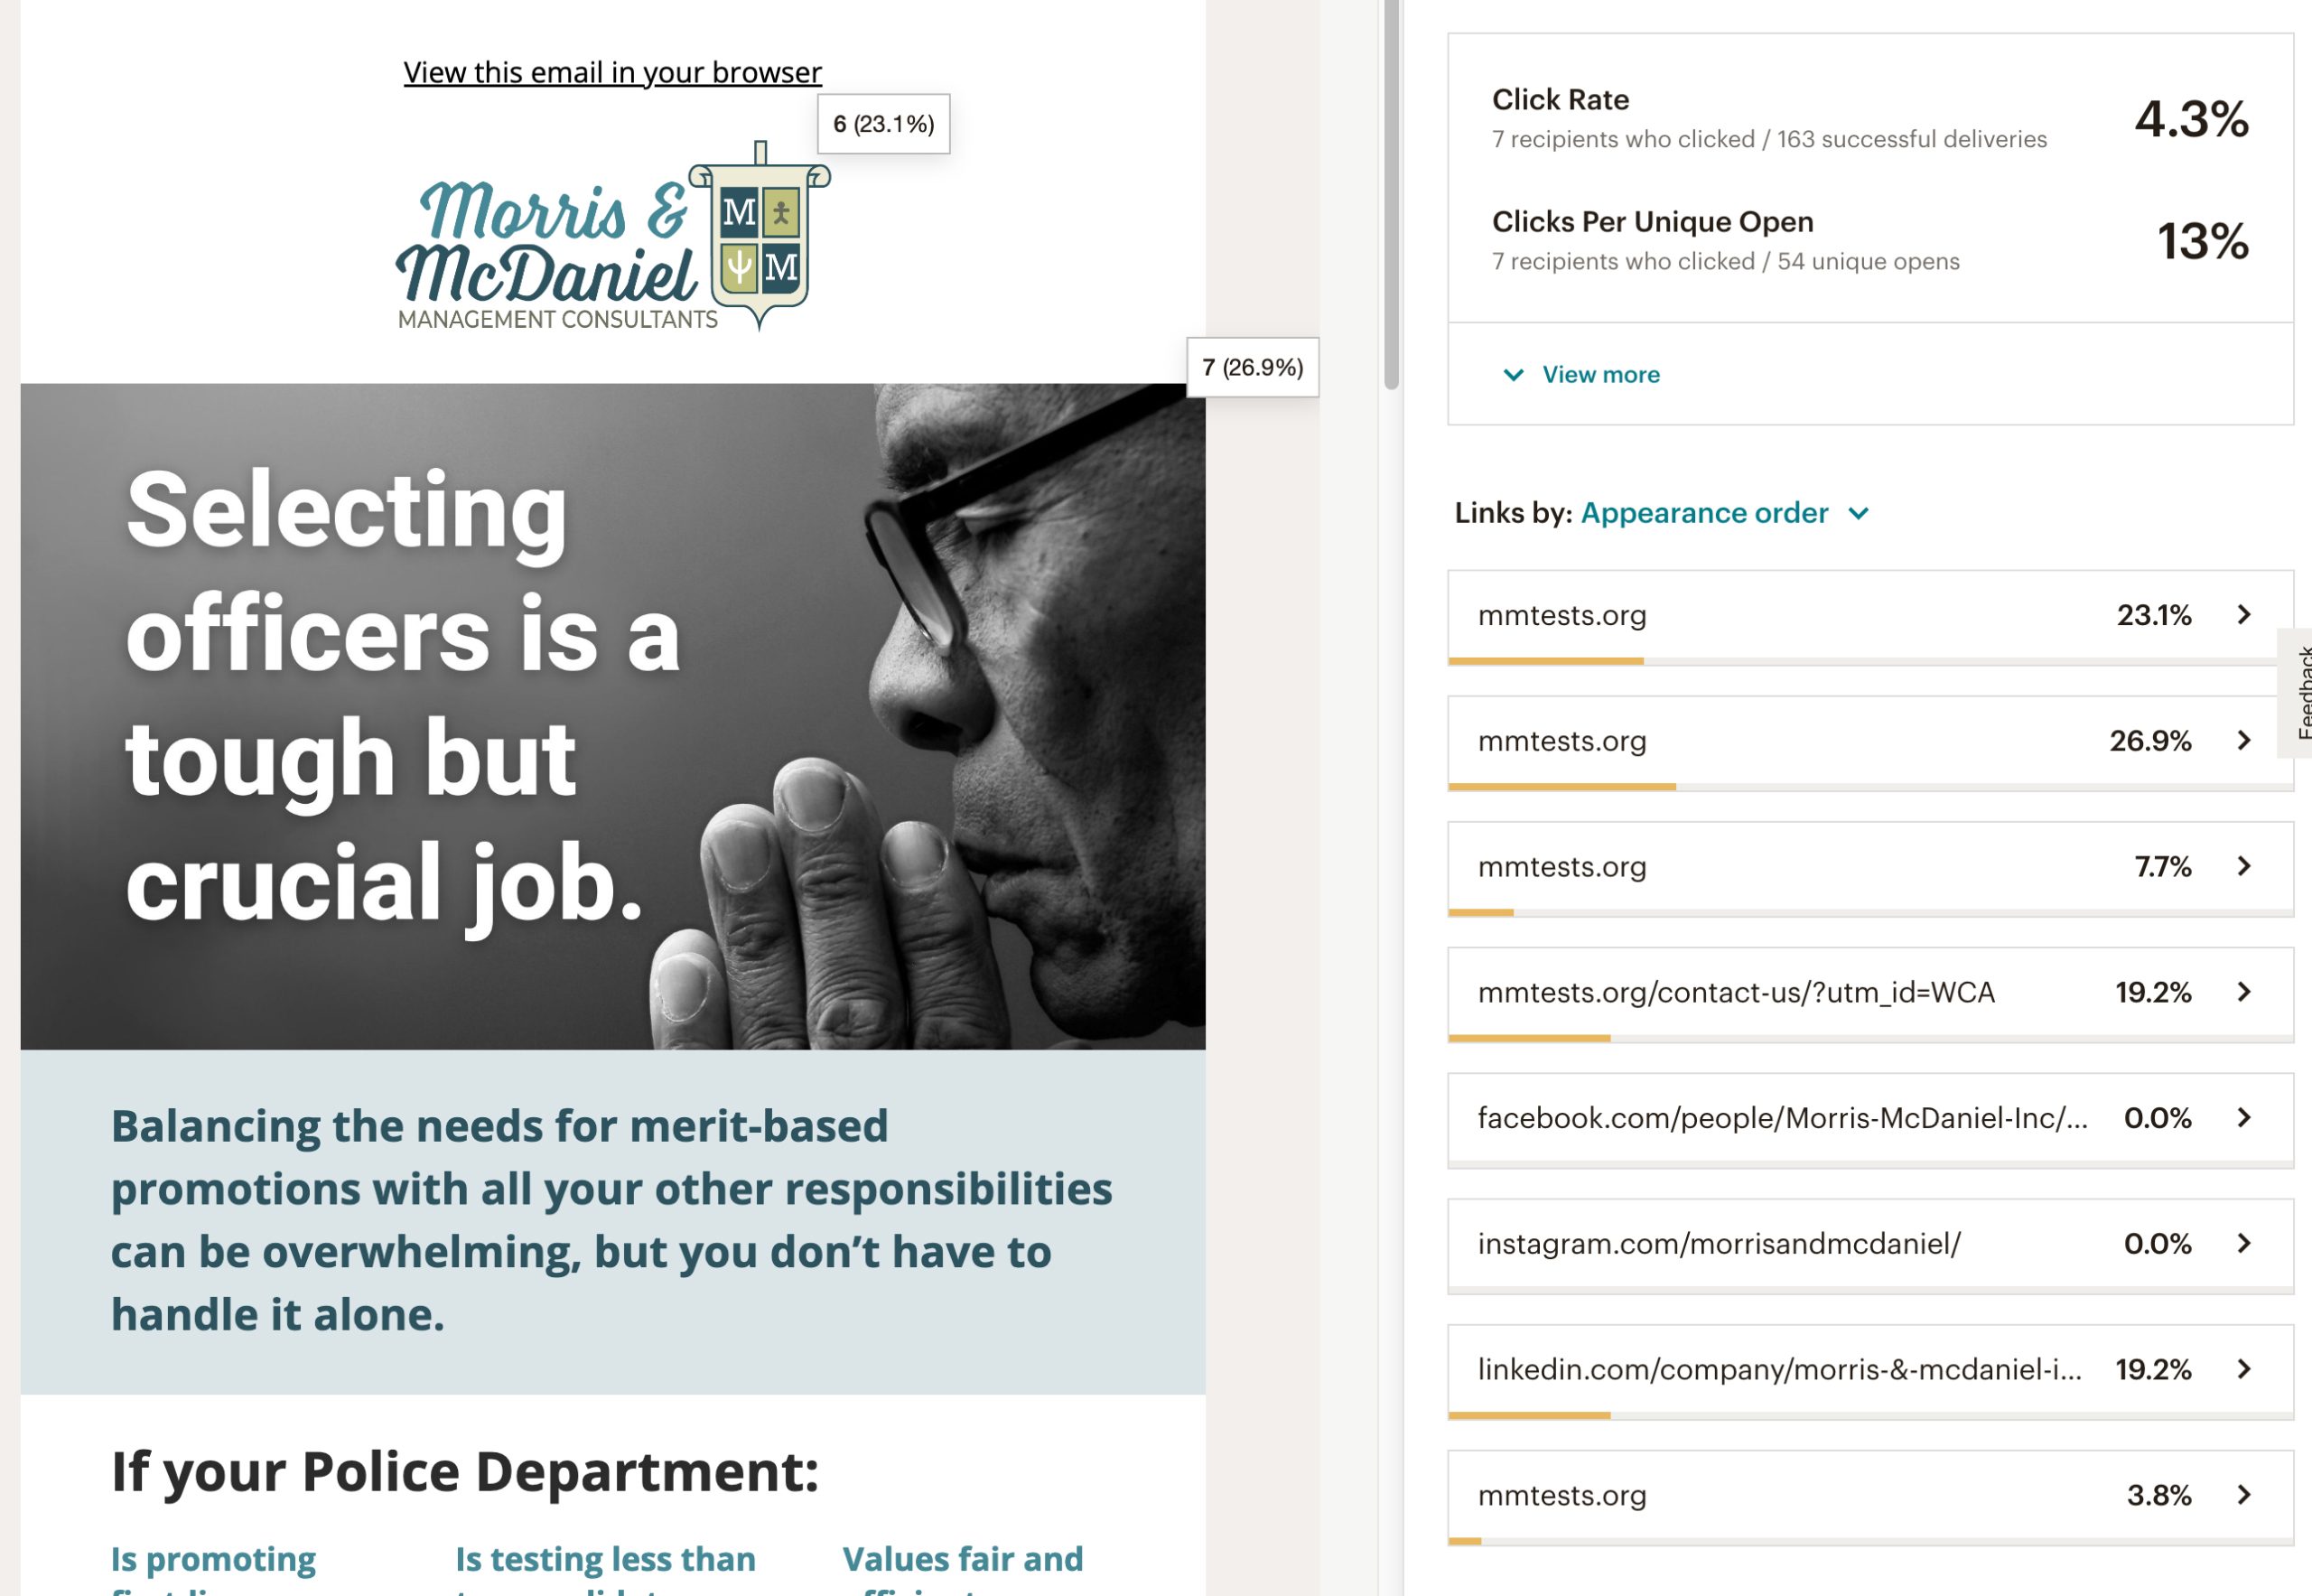
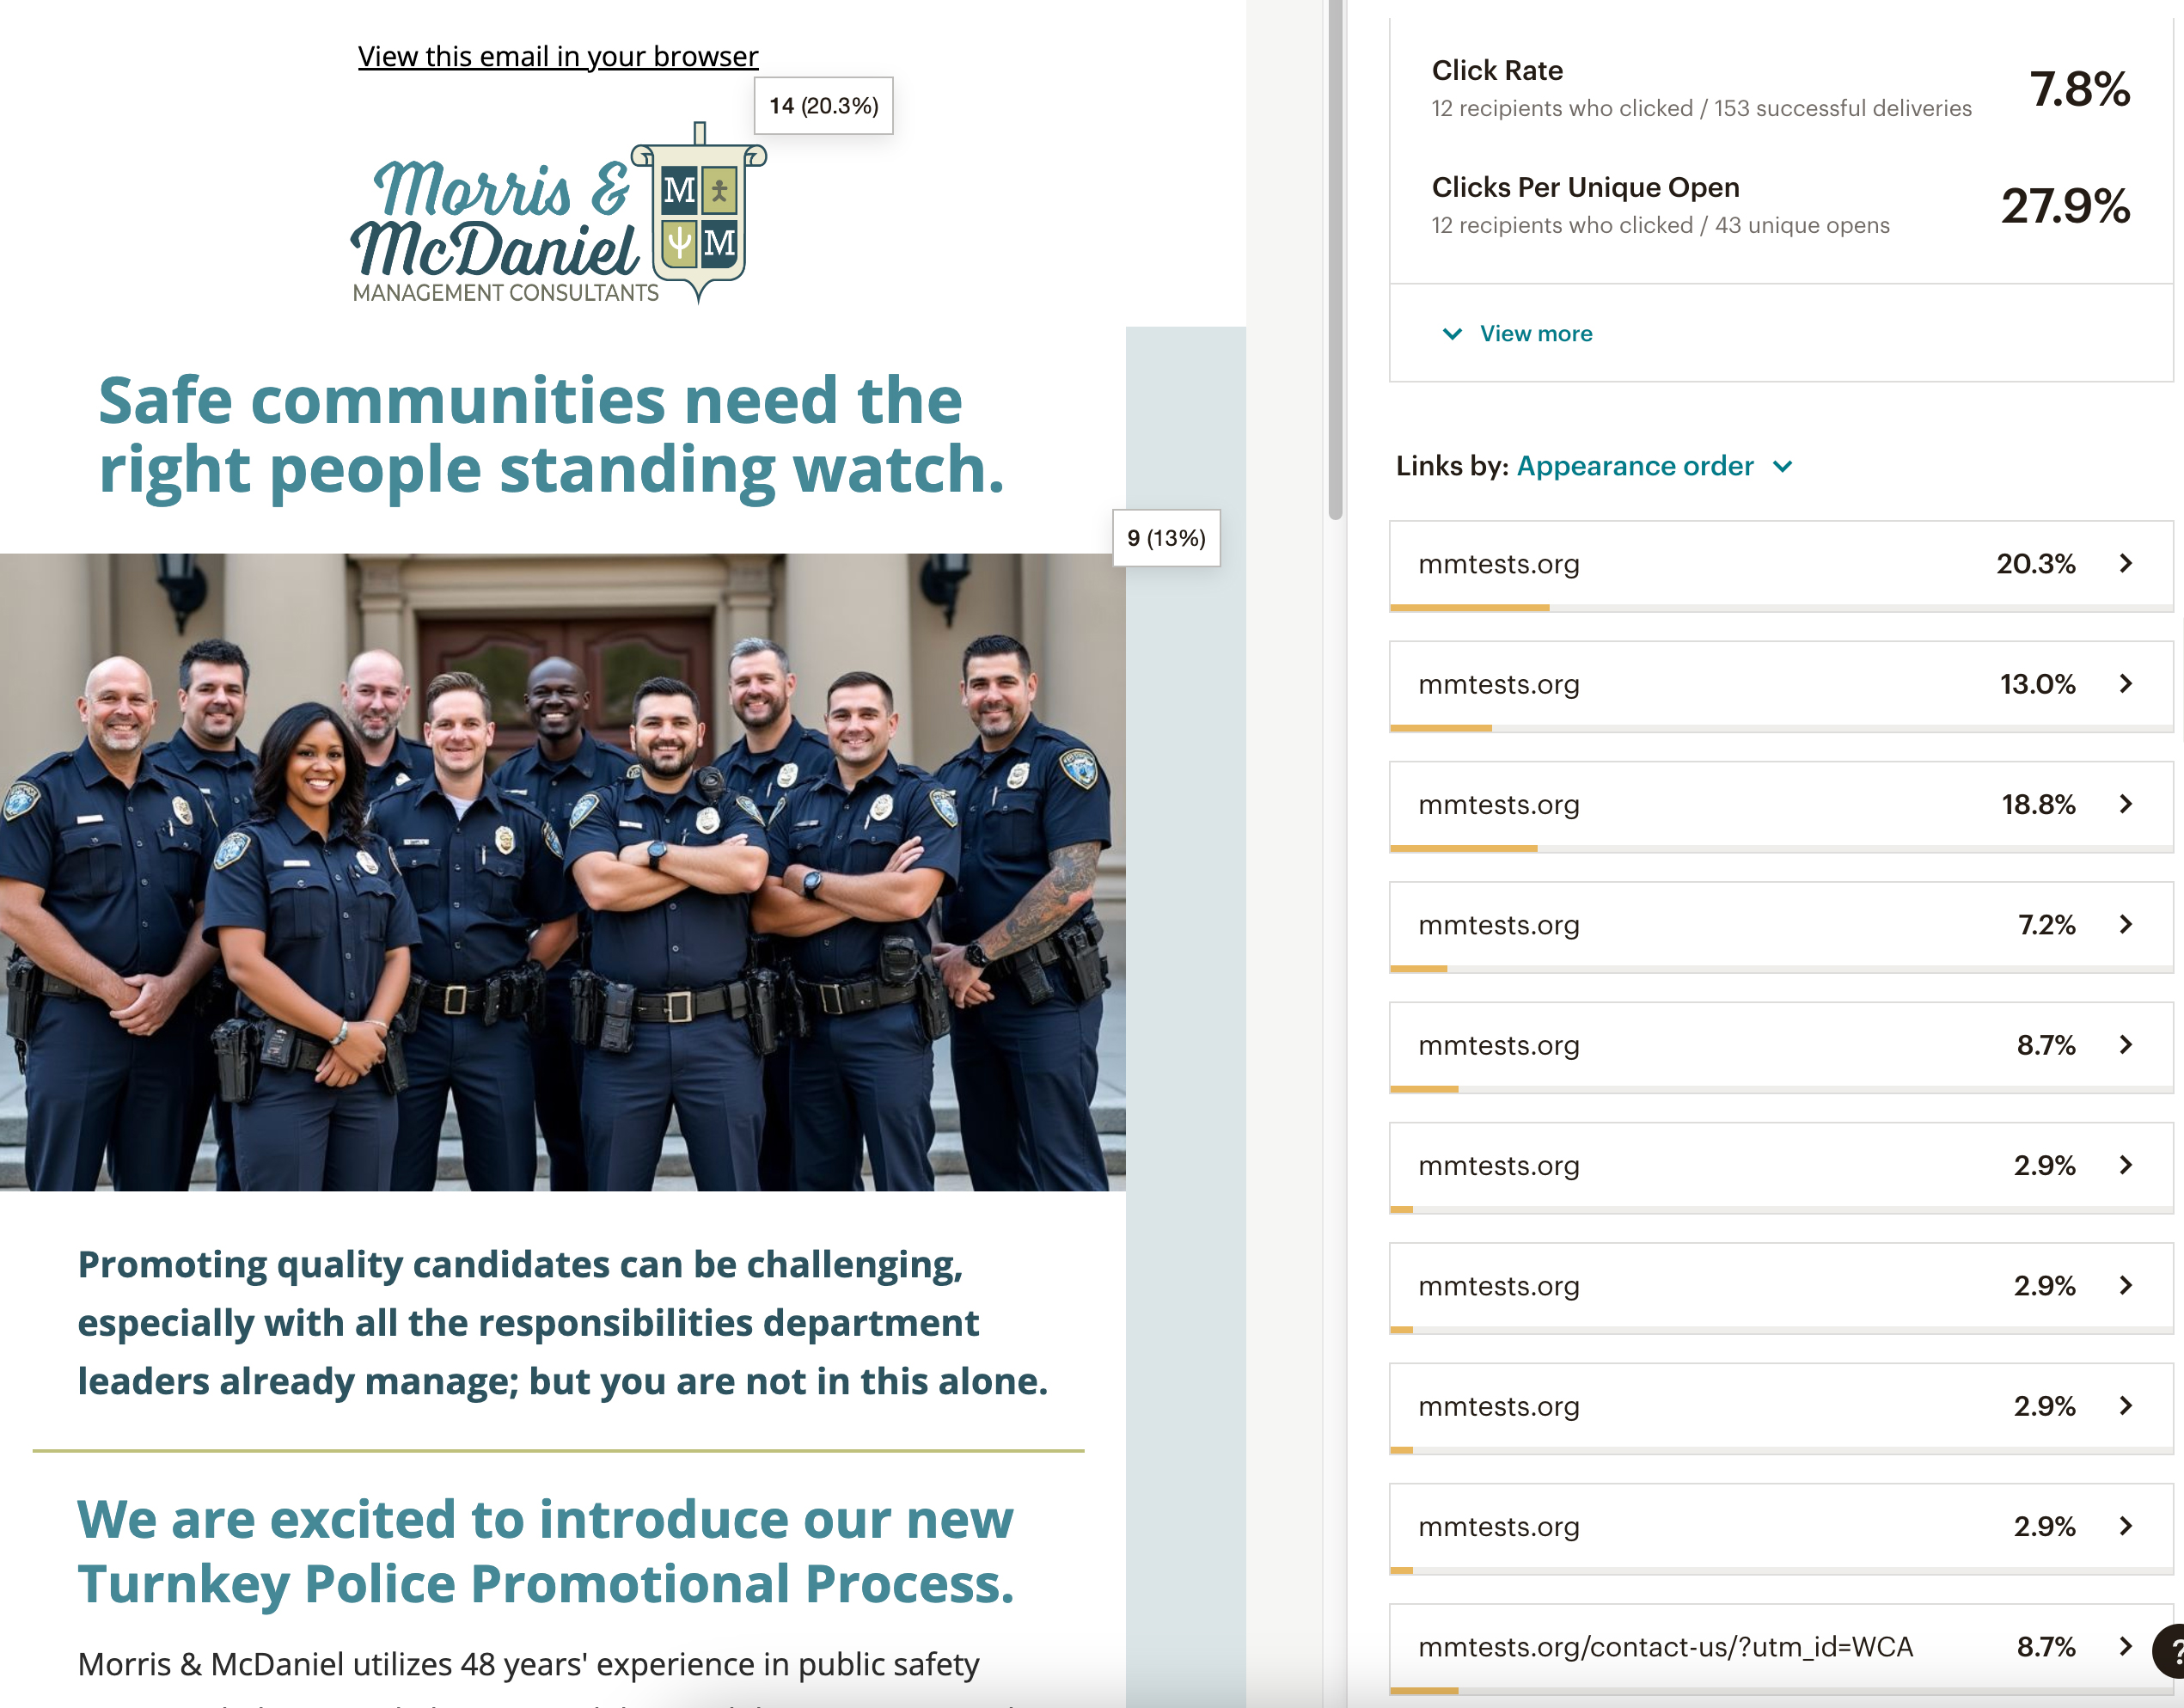
Police Turnkey
Sent: Mon September 23, 2024 1:30 pm
Design One Open Rate: 29.5%
Design One Open Rate: 33.1%
Design One Open Rate: 28.1%
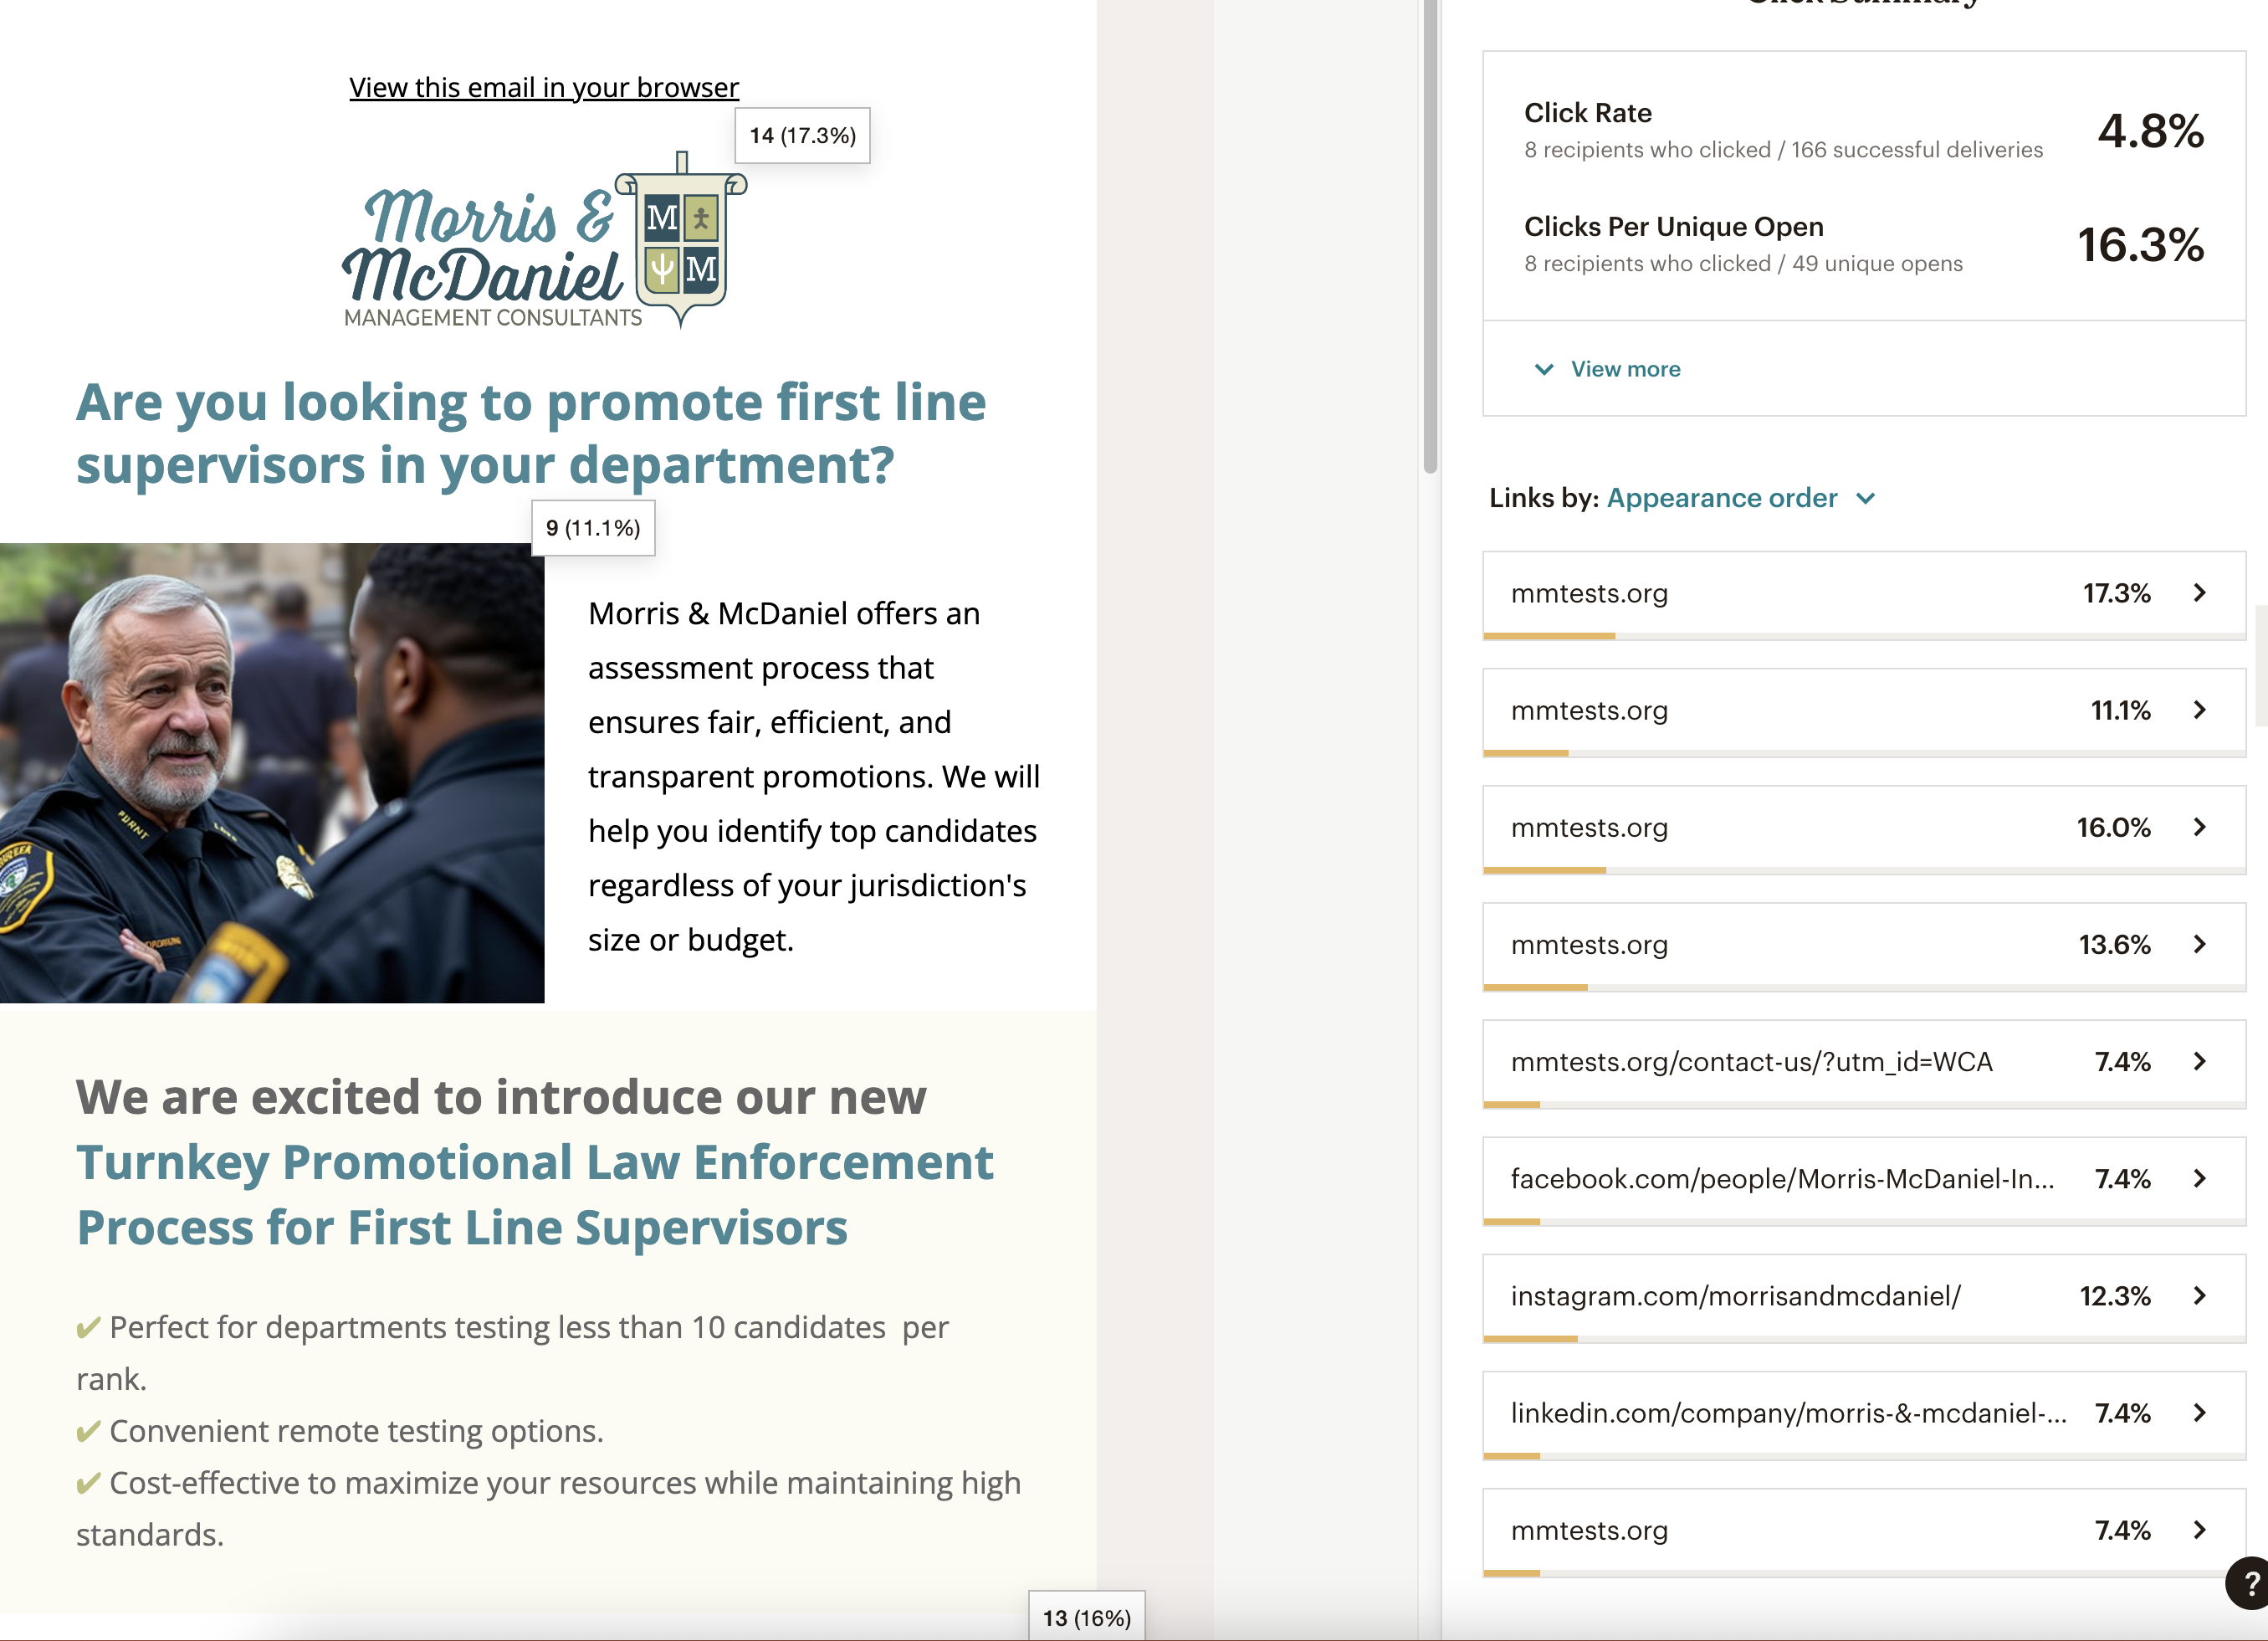
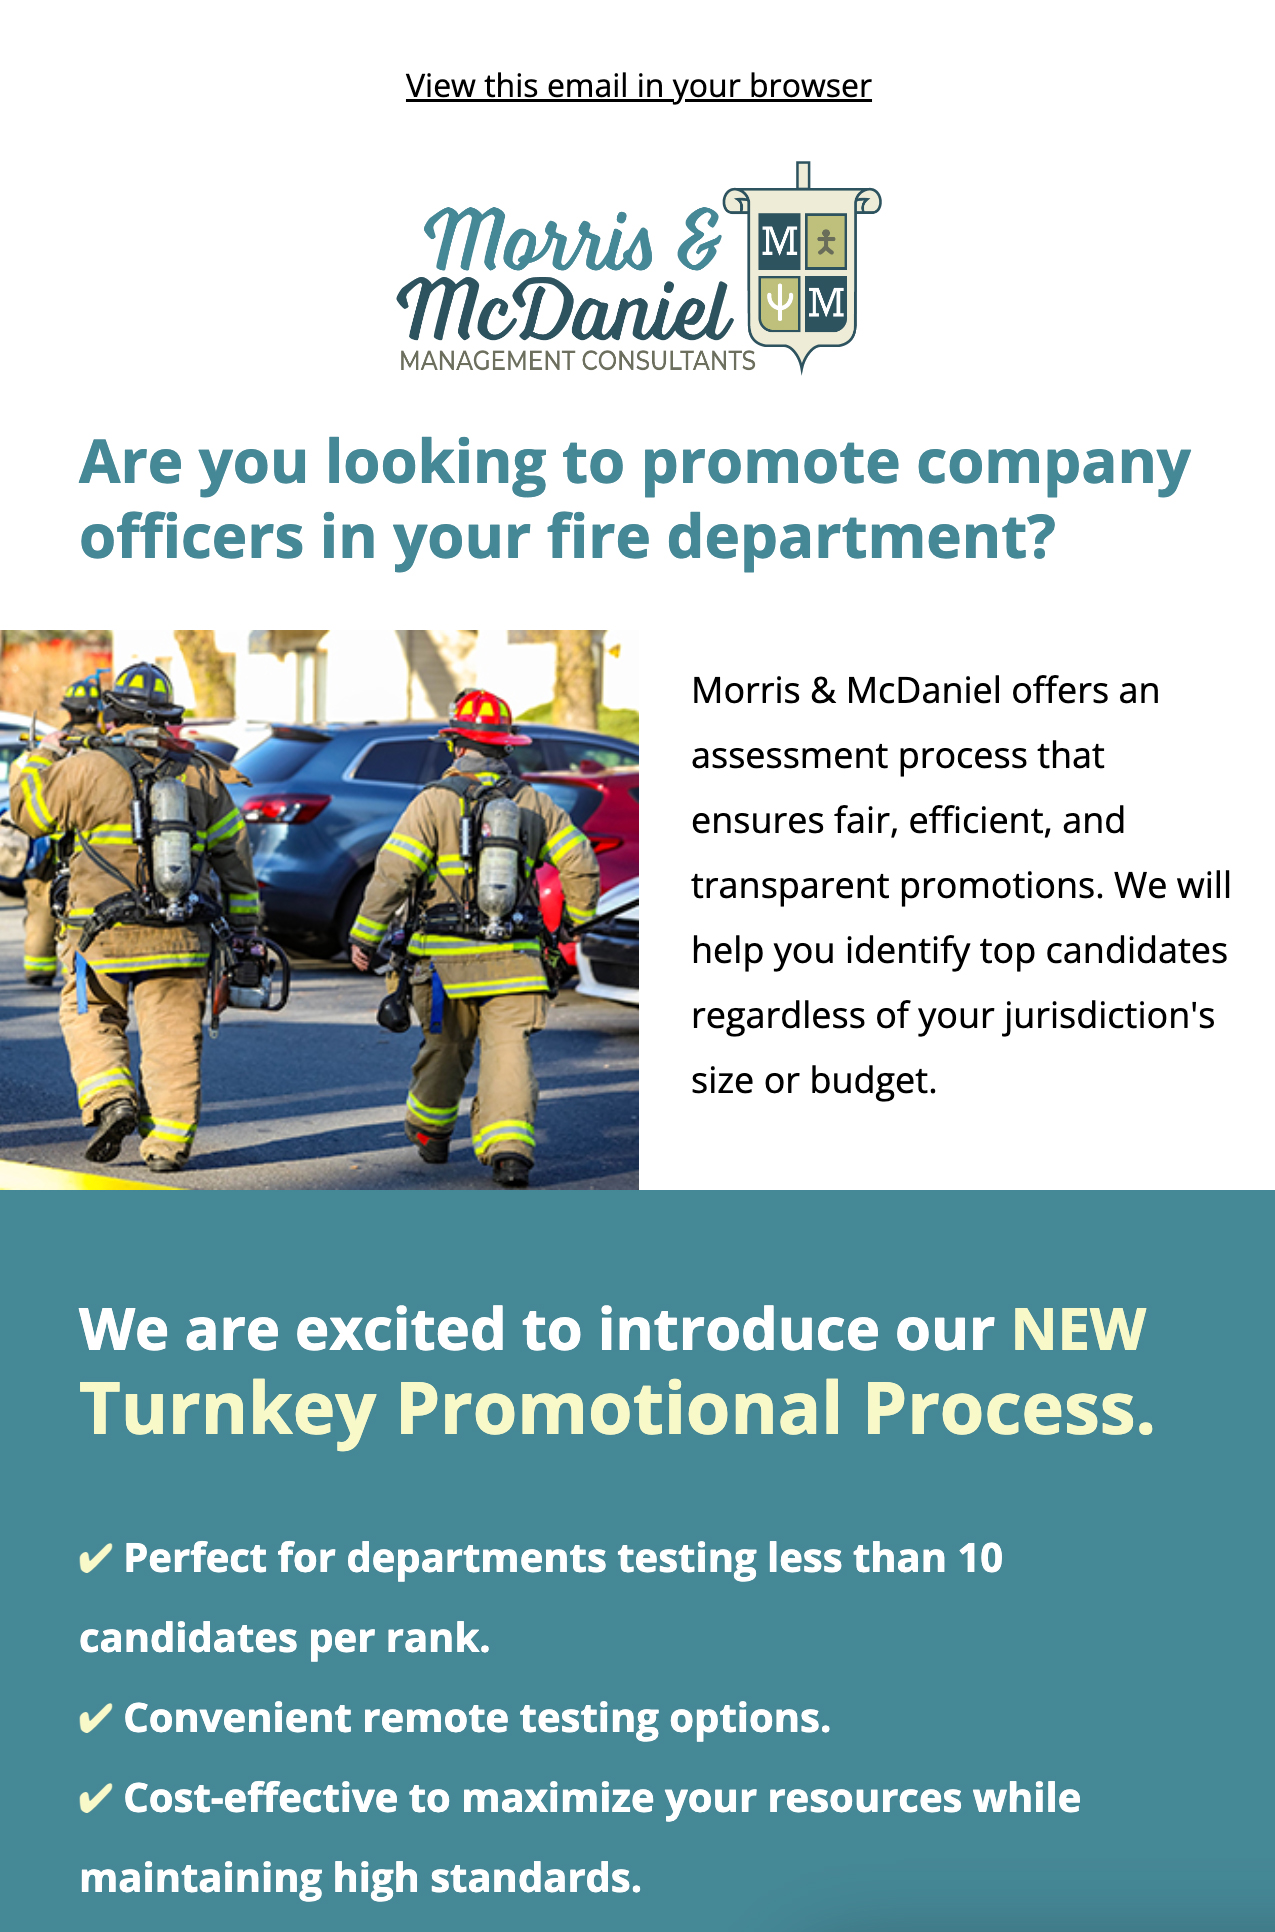
Fire Turnkey
Sent: Mon September 30, 2024 1:30 pm
Opens: 49
Clicks: 15
CTR: 23%
Organic
• Users: 179
• Avg. Time on Site – 46 sec.
• Purchases: $9.99
Bing
• Users: 26
• Avg. Time on Site – 38 sec.
• Purchases: 0
Yahoo
• Users: 2
• Avg. Time on Site – 1 min 41 sec.
• Purchases: 1
DuckDuckGo
• Users: 1
• Avg. Time on Site – 8 sec.
• Purchases: 0
Total
208
Previous Period - Sept. 1 - 15
• Users: 161
• Avg. Time on Site – 1 min. 2 sec.
• Purchases: $49.99
Bing
• Users: 34
• Avg. Time on Site – 1 min 15 sec.
• Purchases: 0
Yahoo
• Users: 10
• Avg. Time on Site – 29 sec.
• Purchases: 0
DuckDuckGo
• Users: 4
• Avg. Time on Site – 11 sec.
• Purchases: 0
Total
209
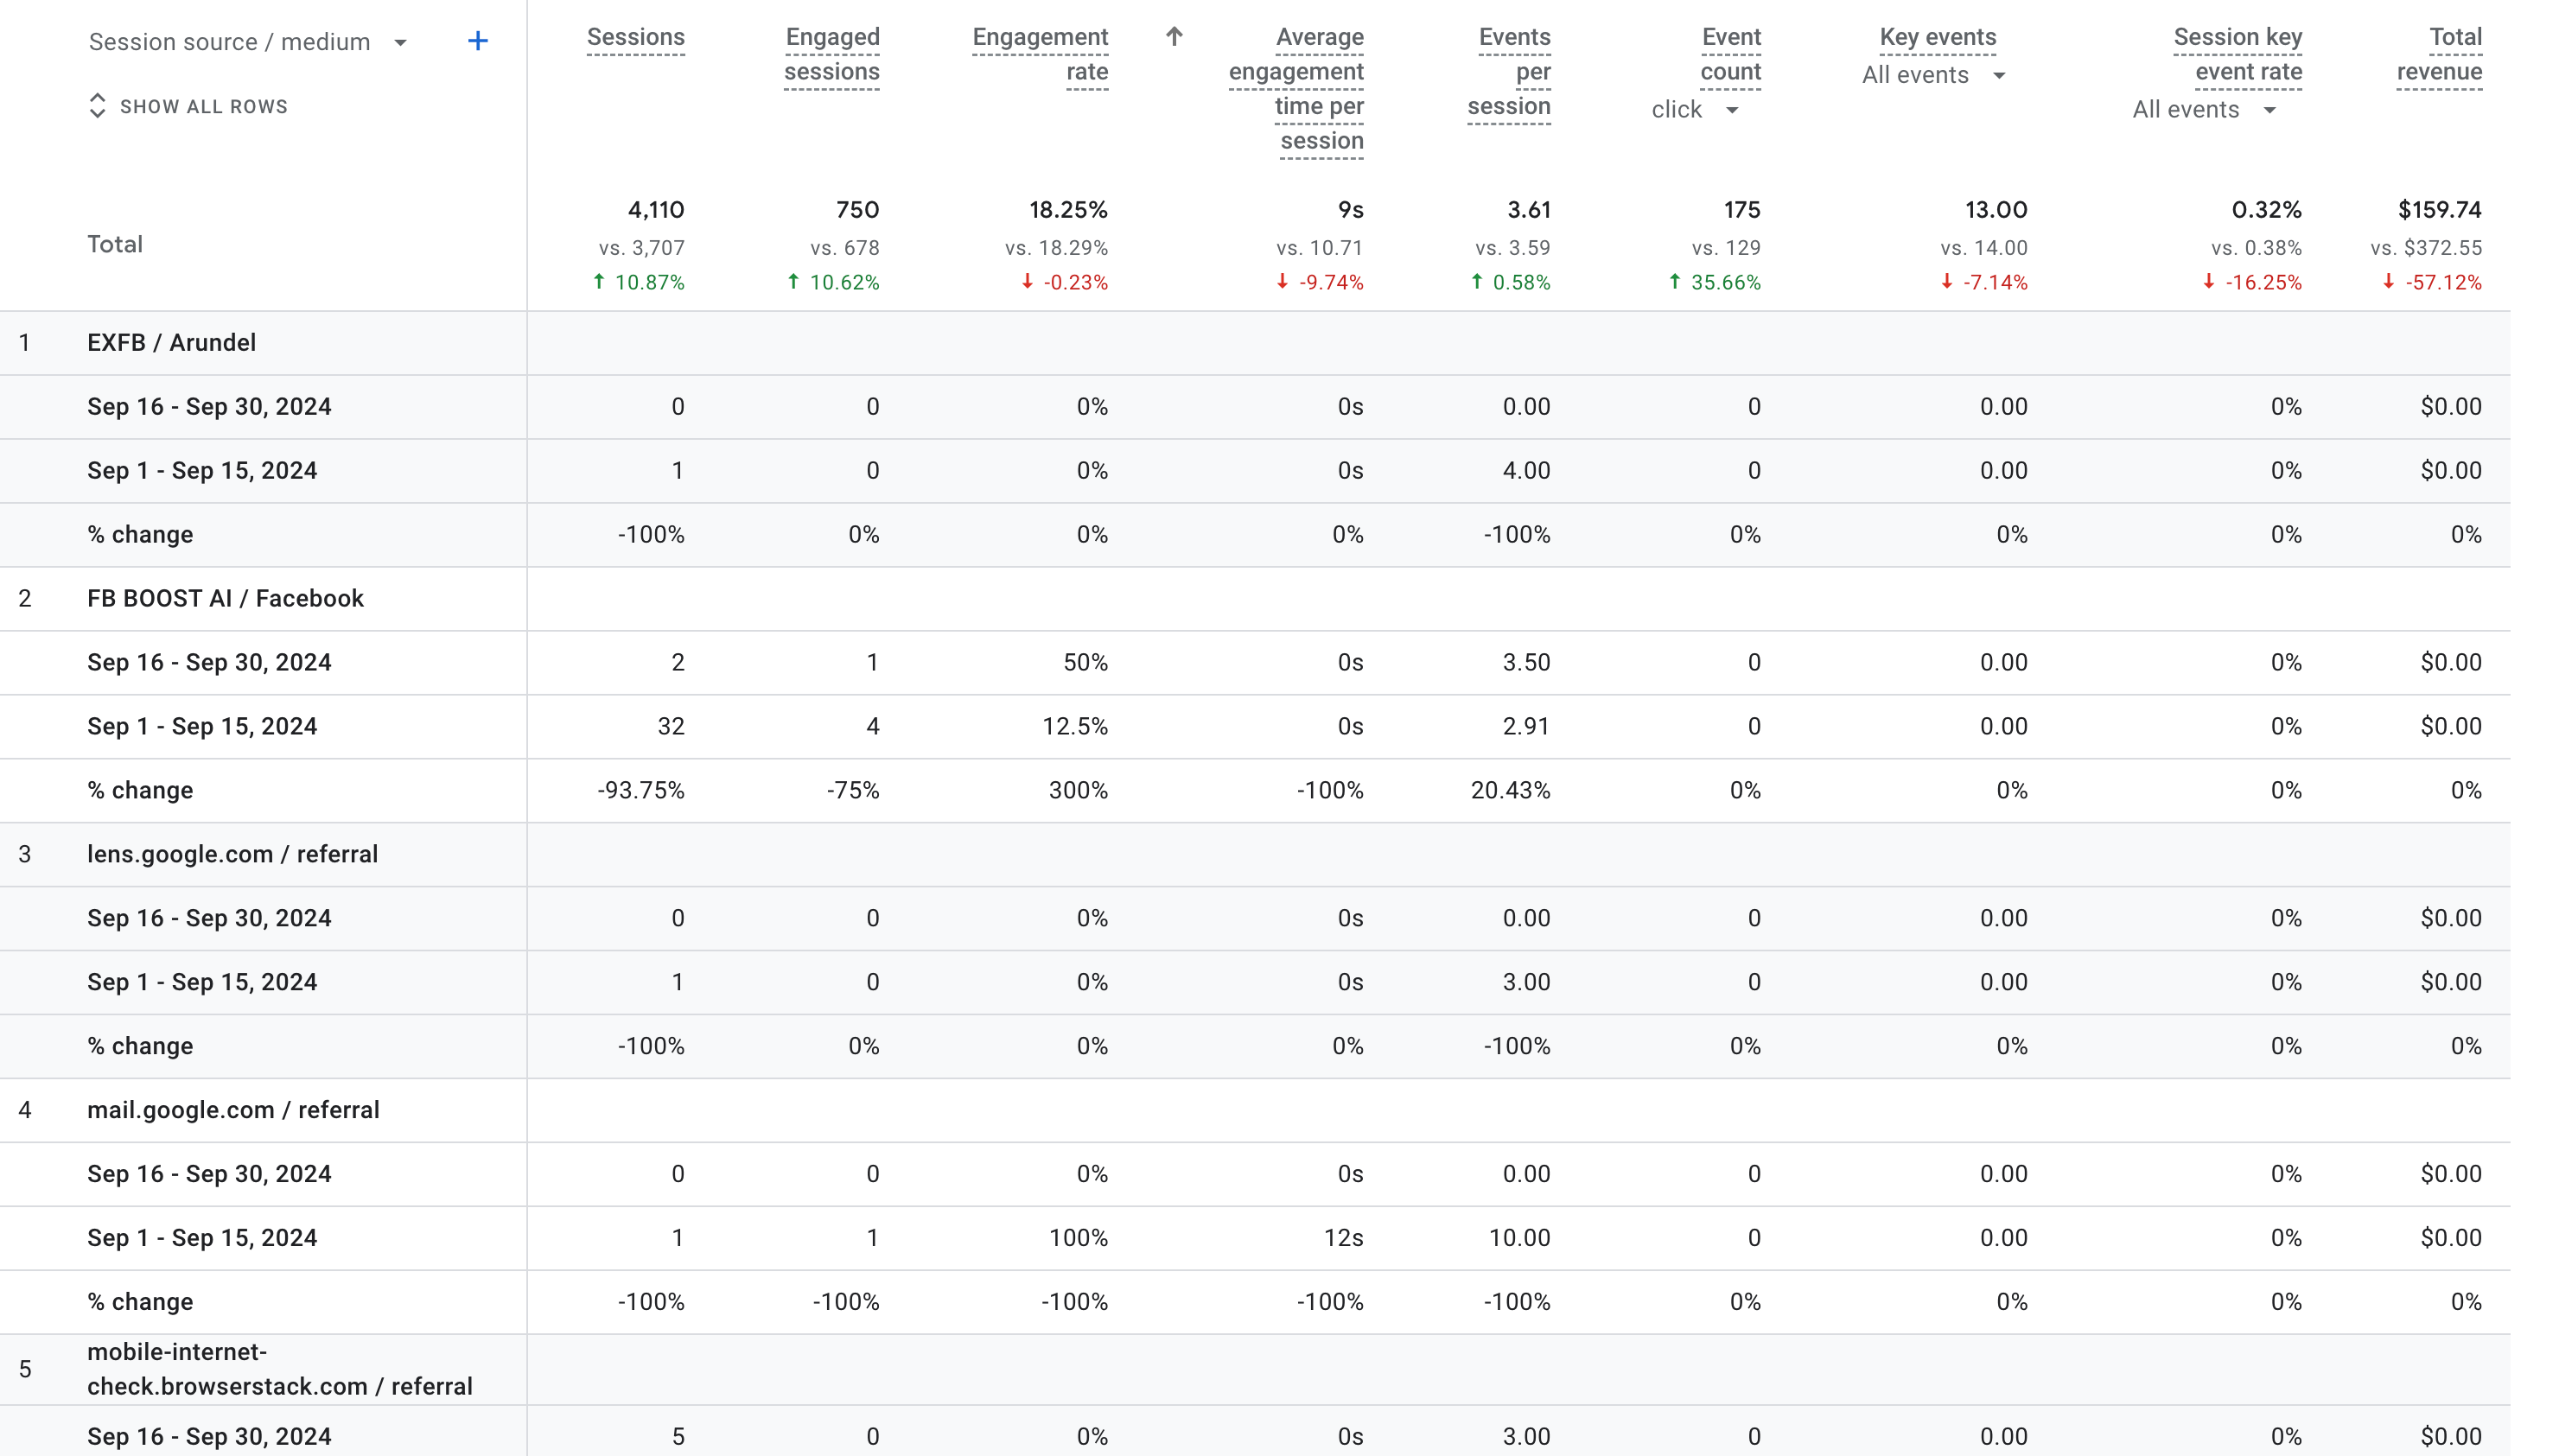
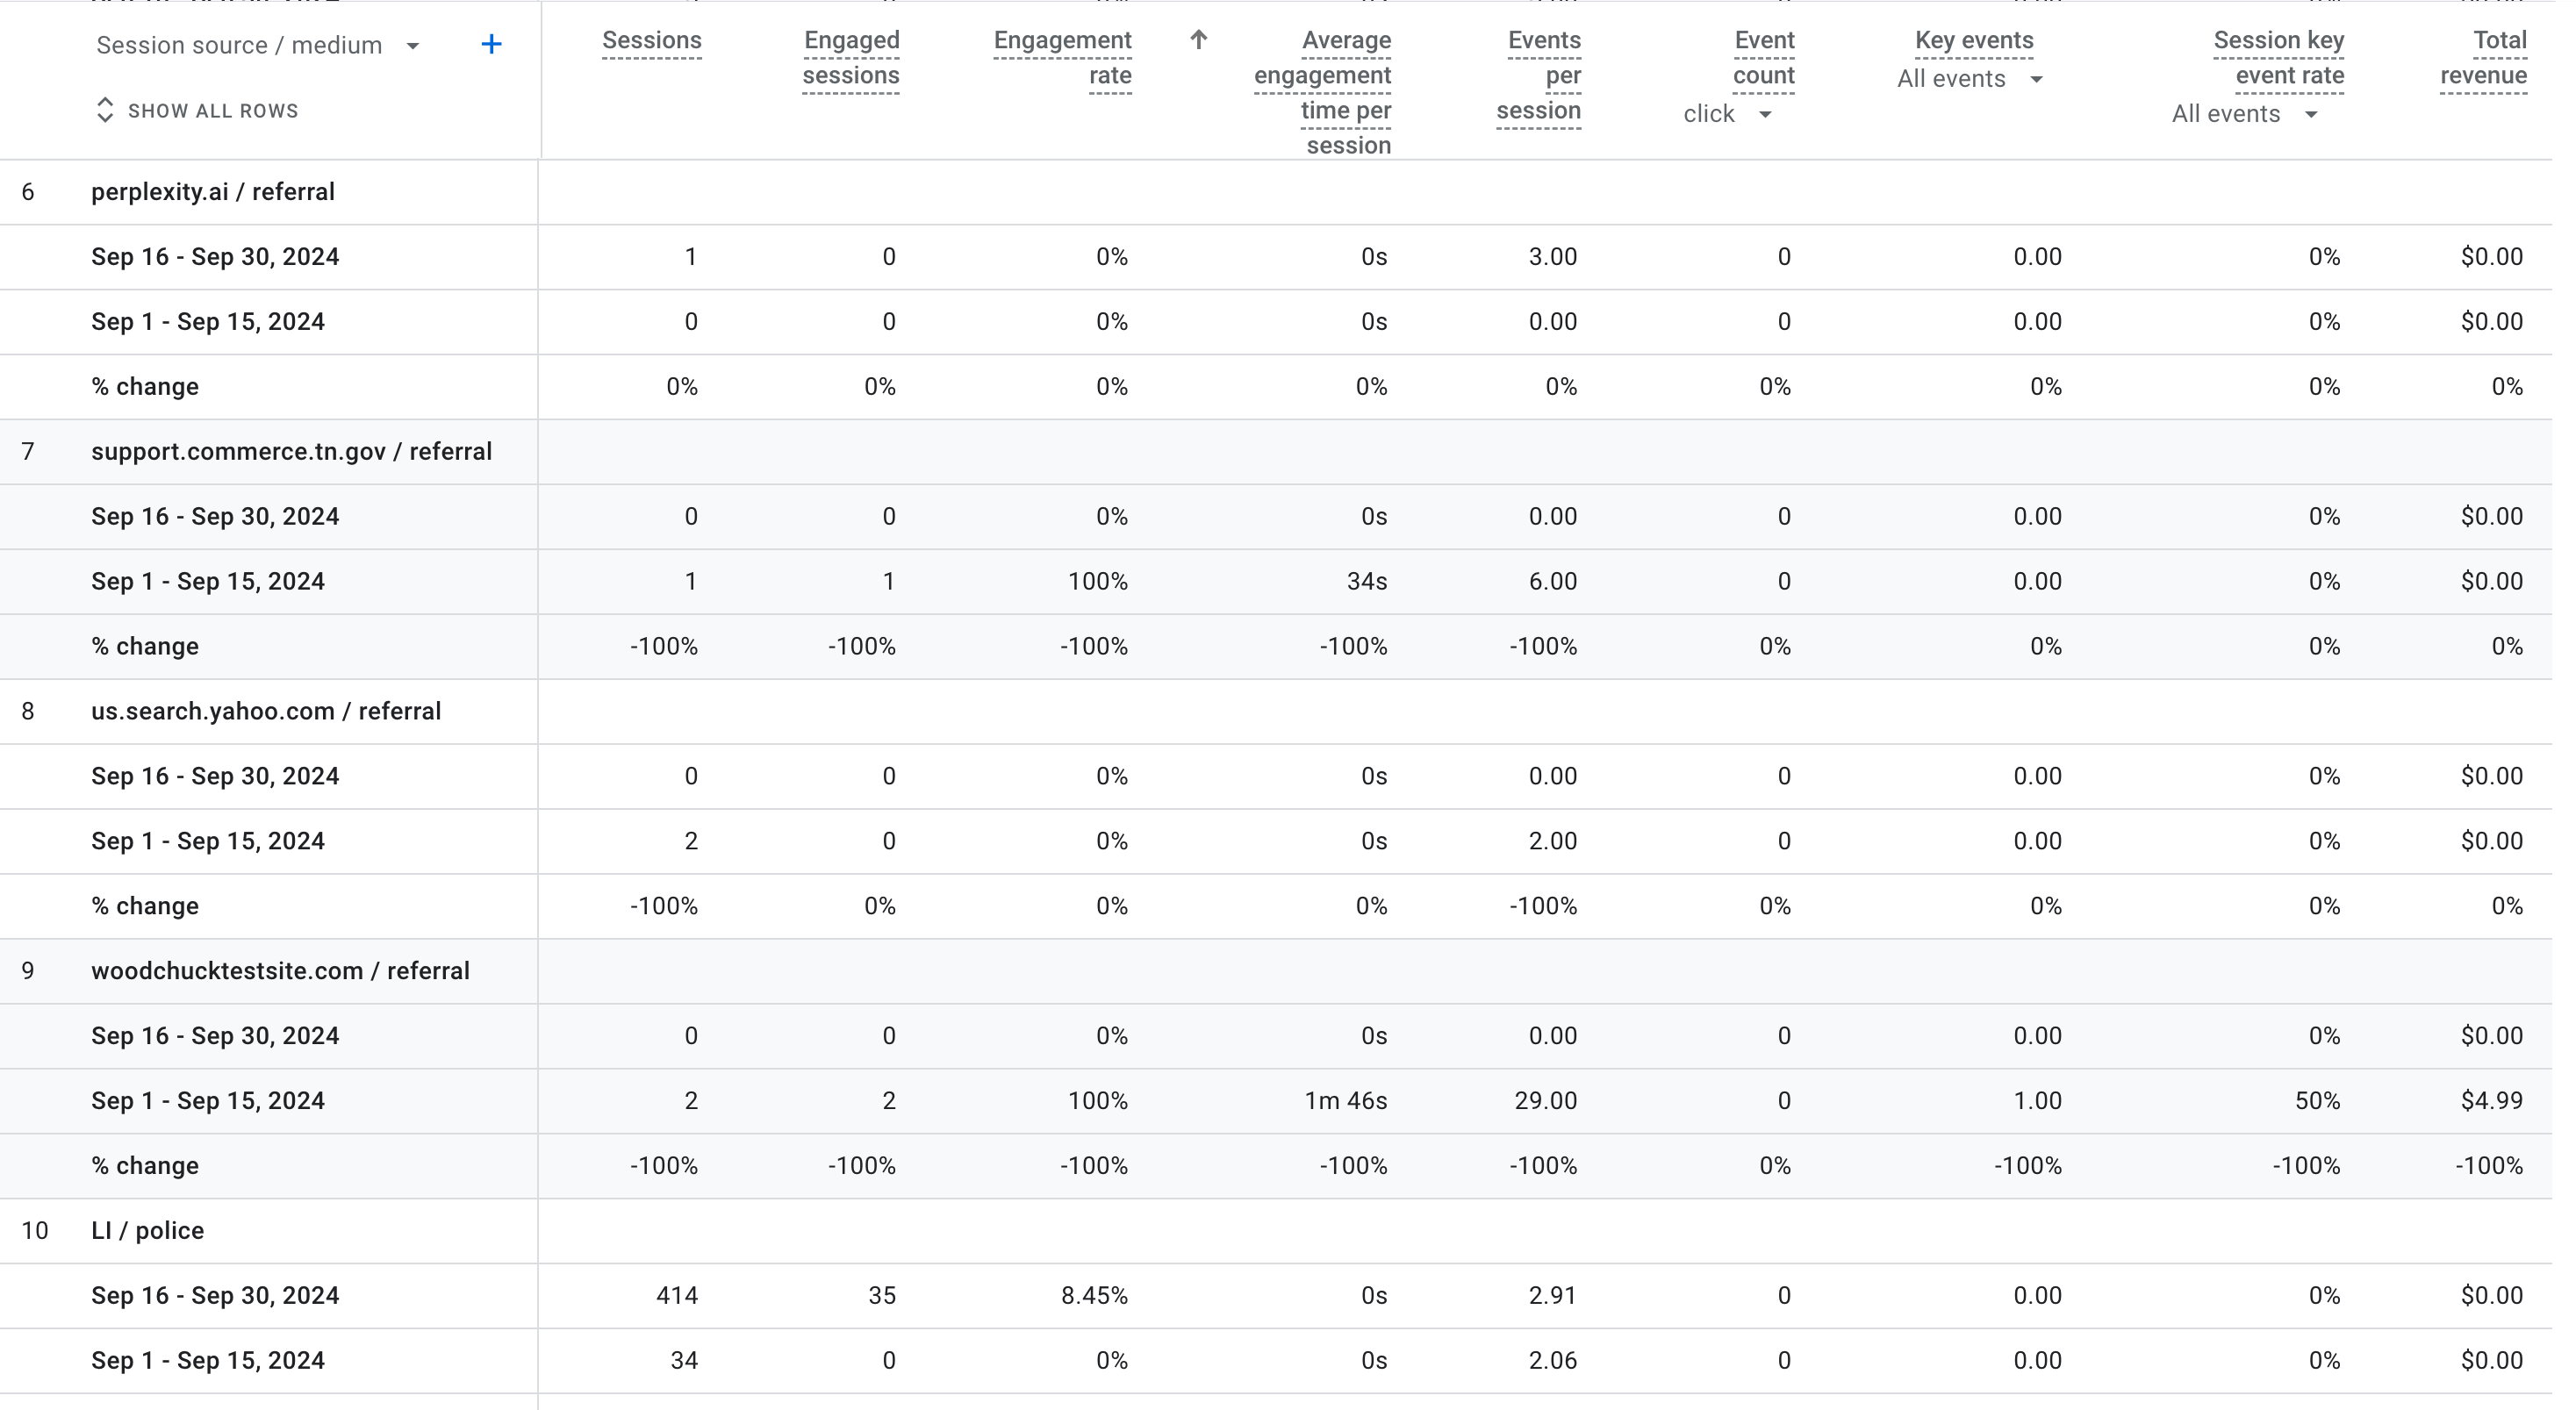
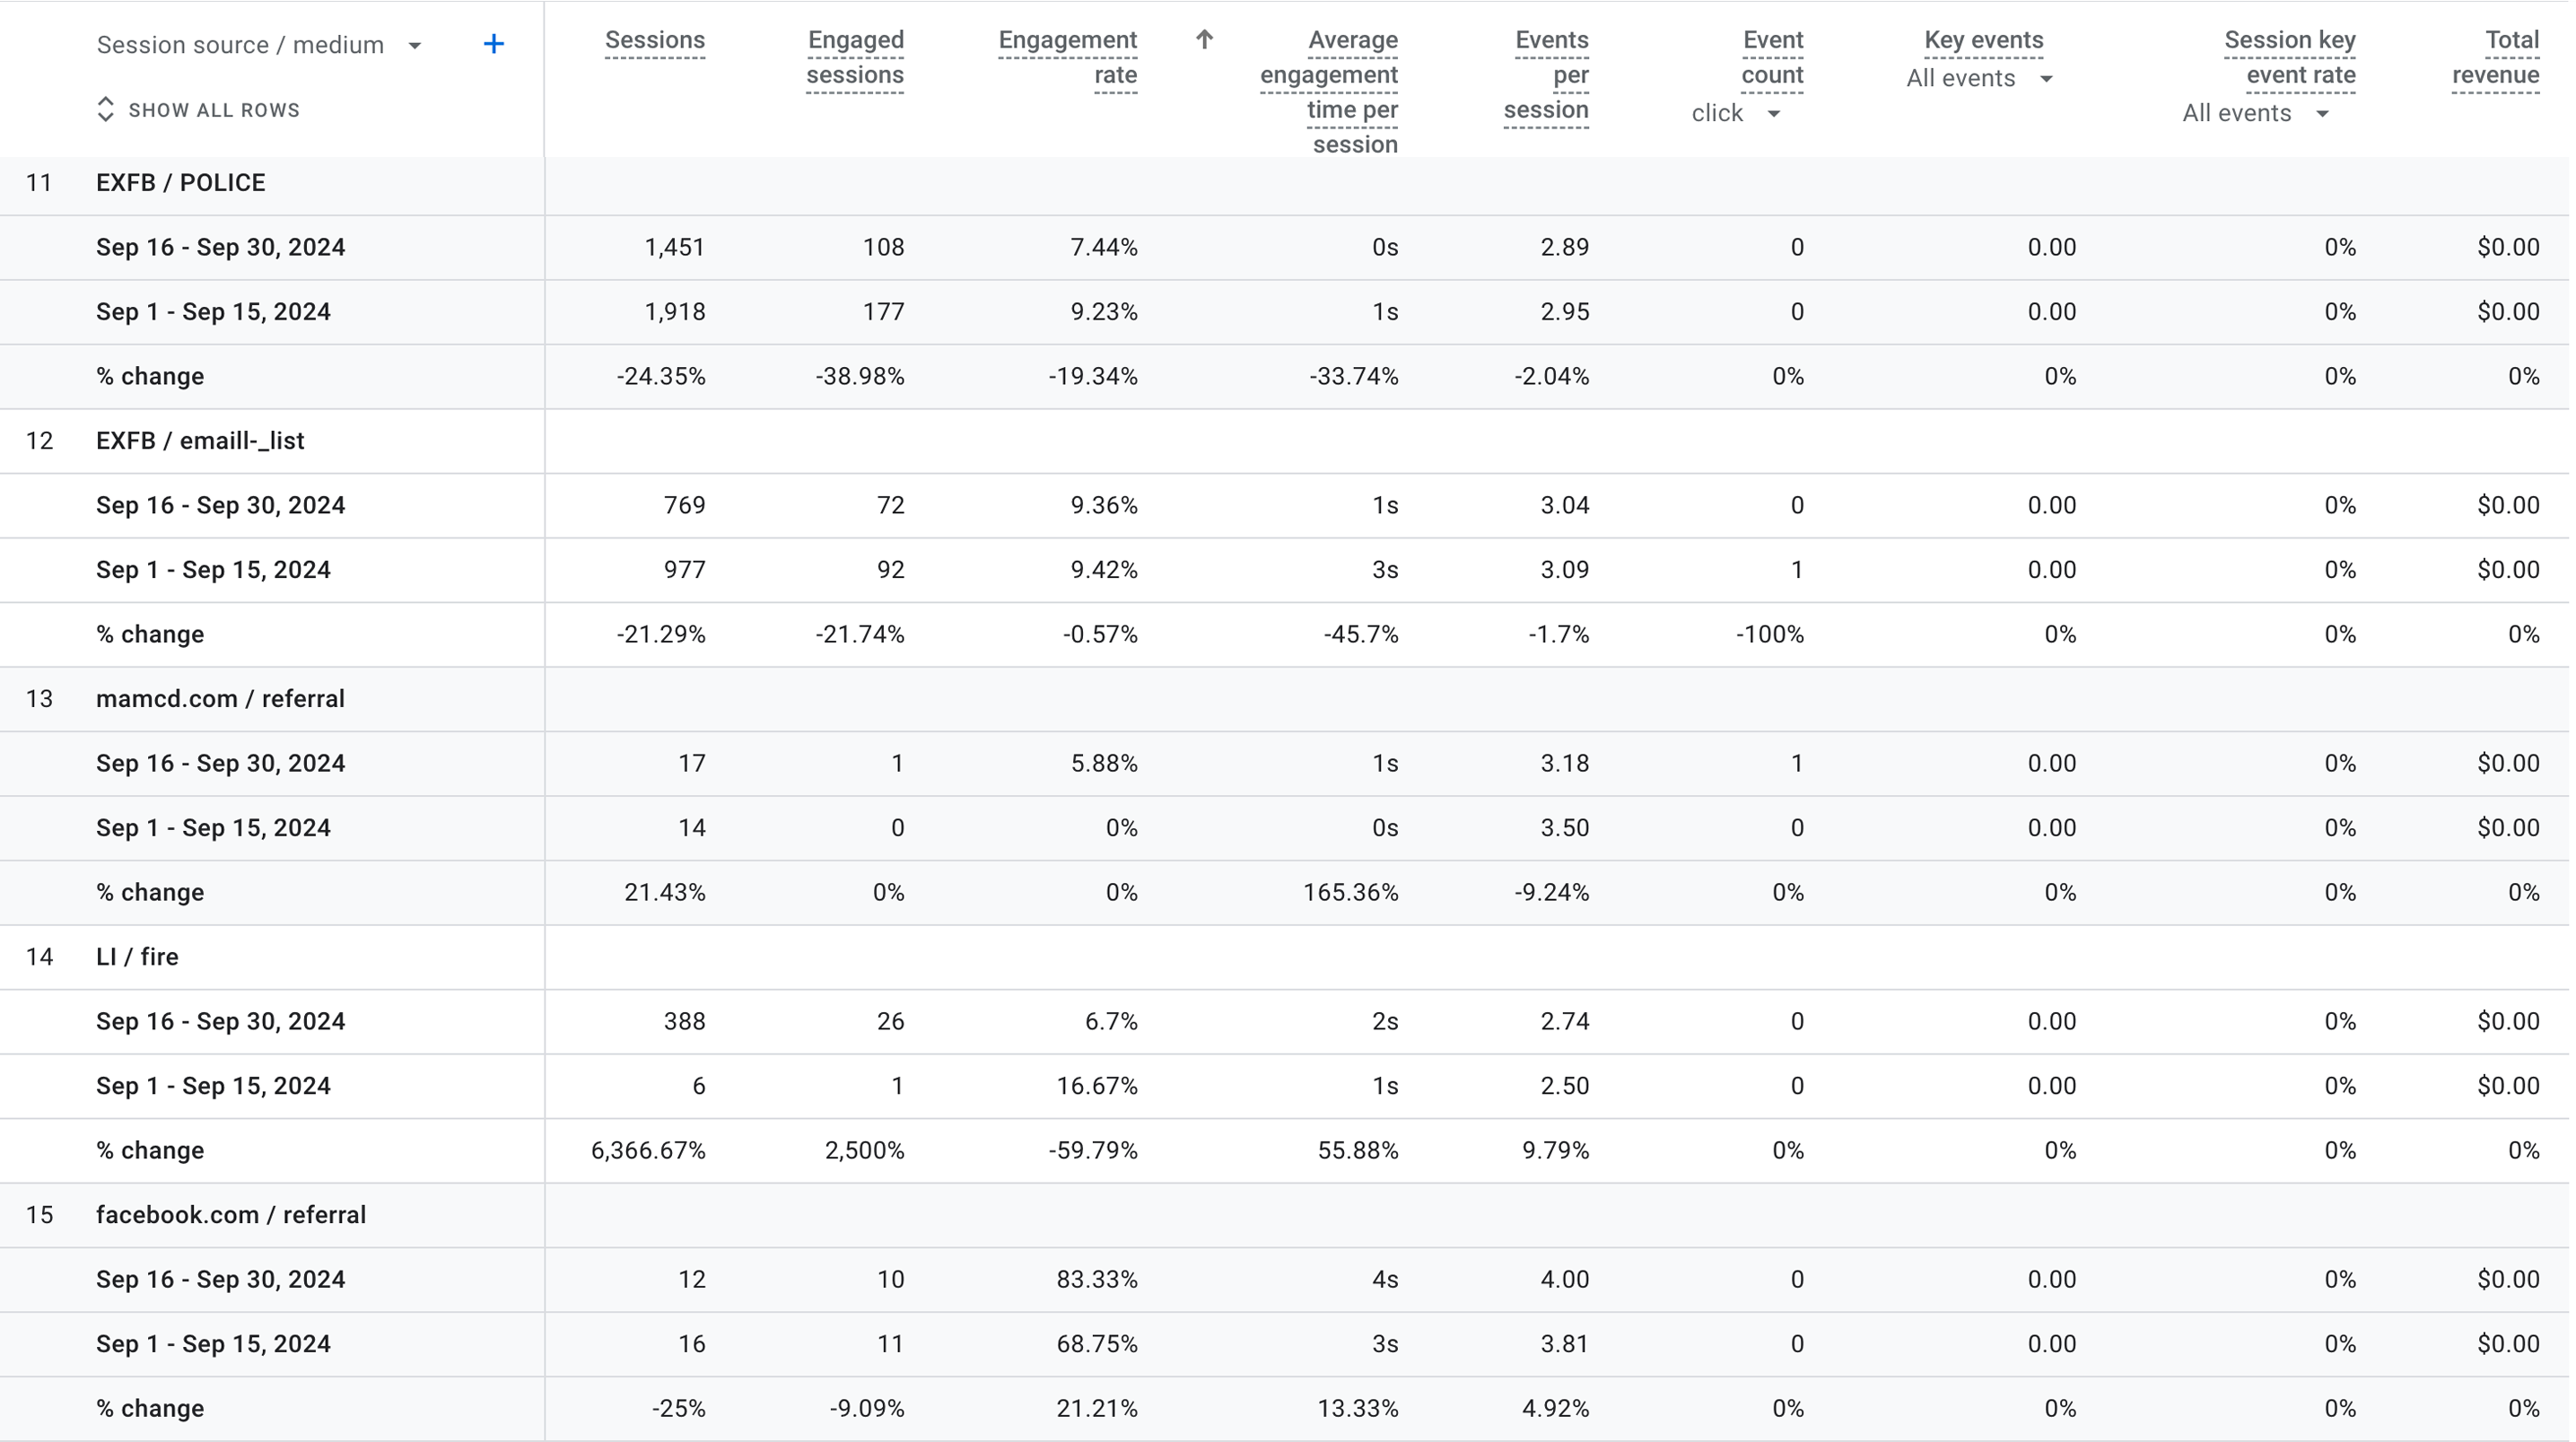
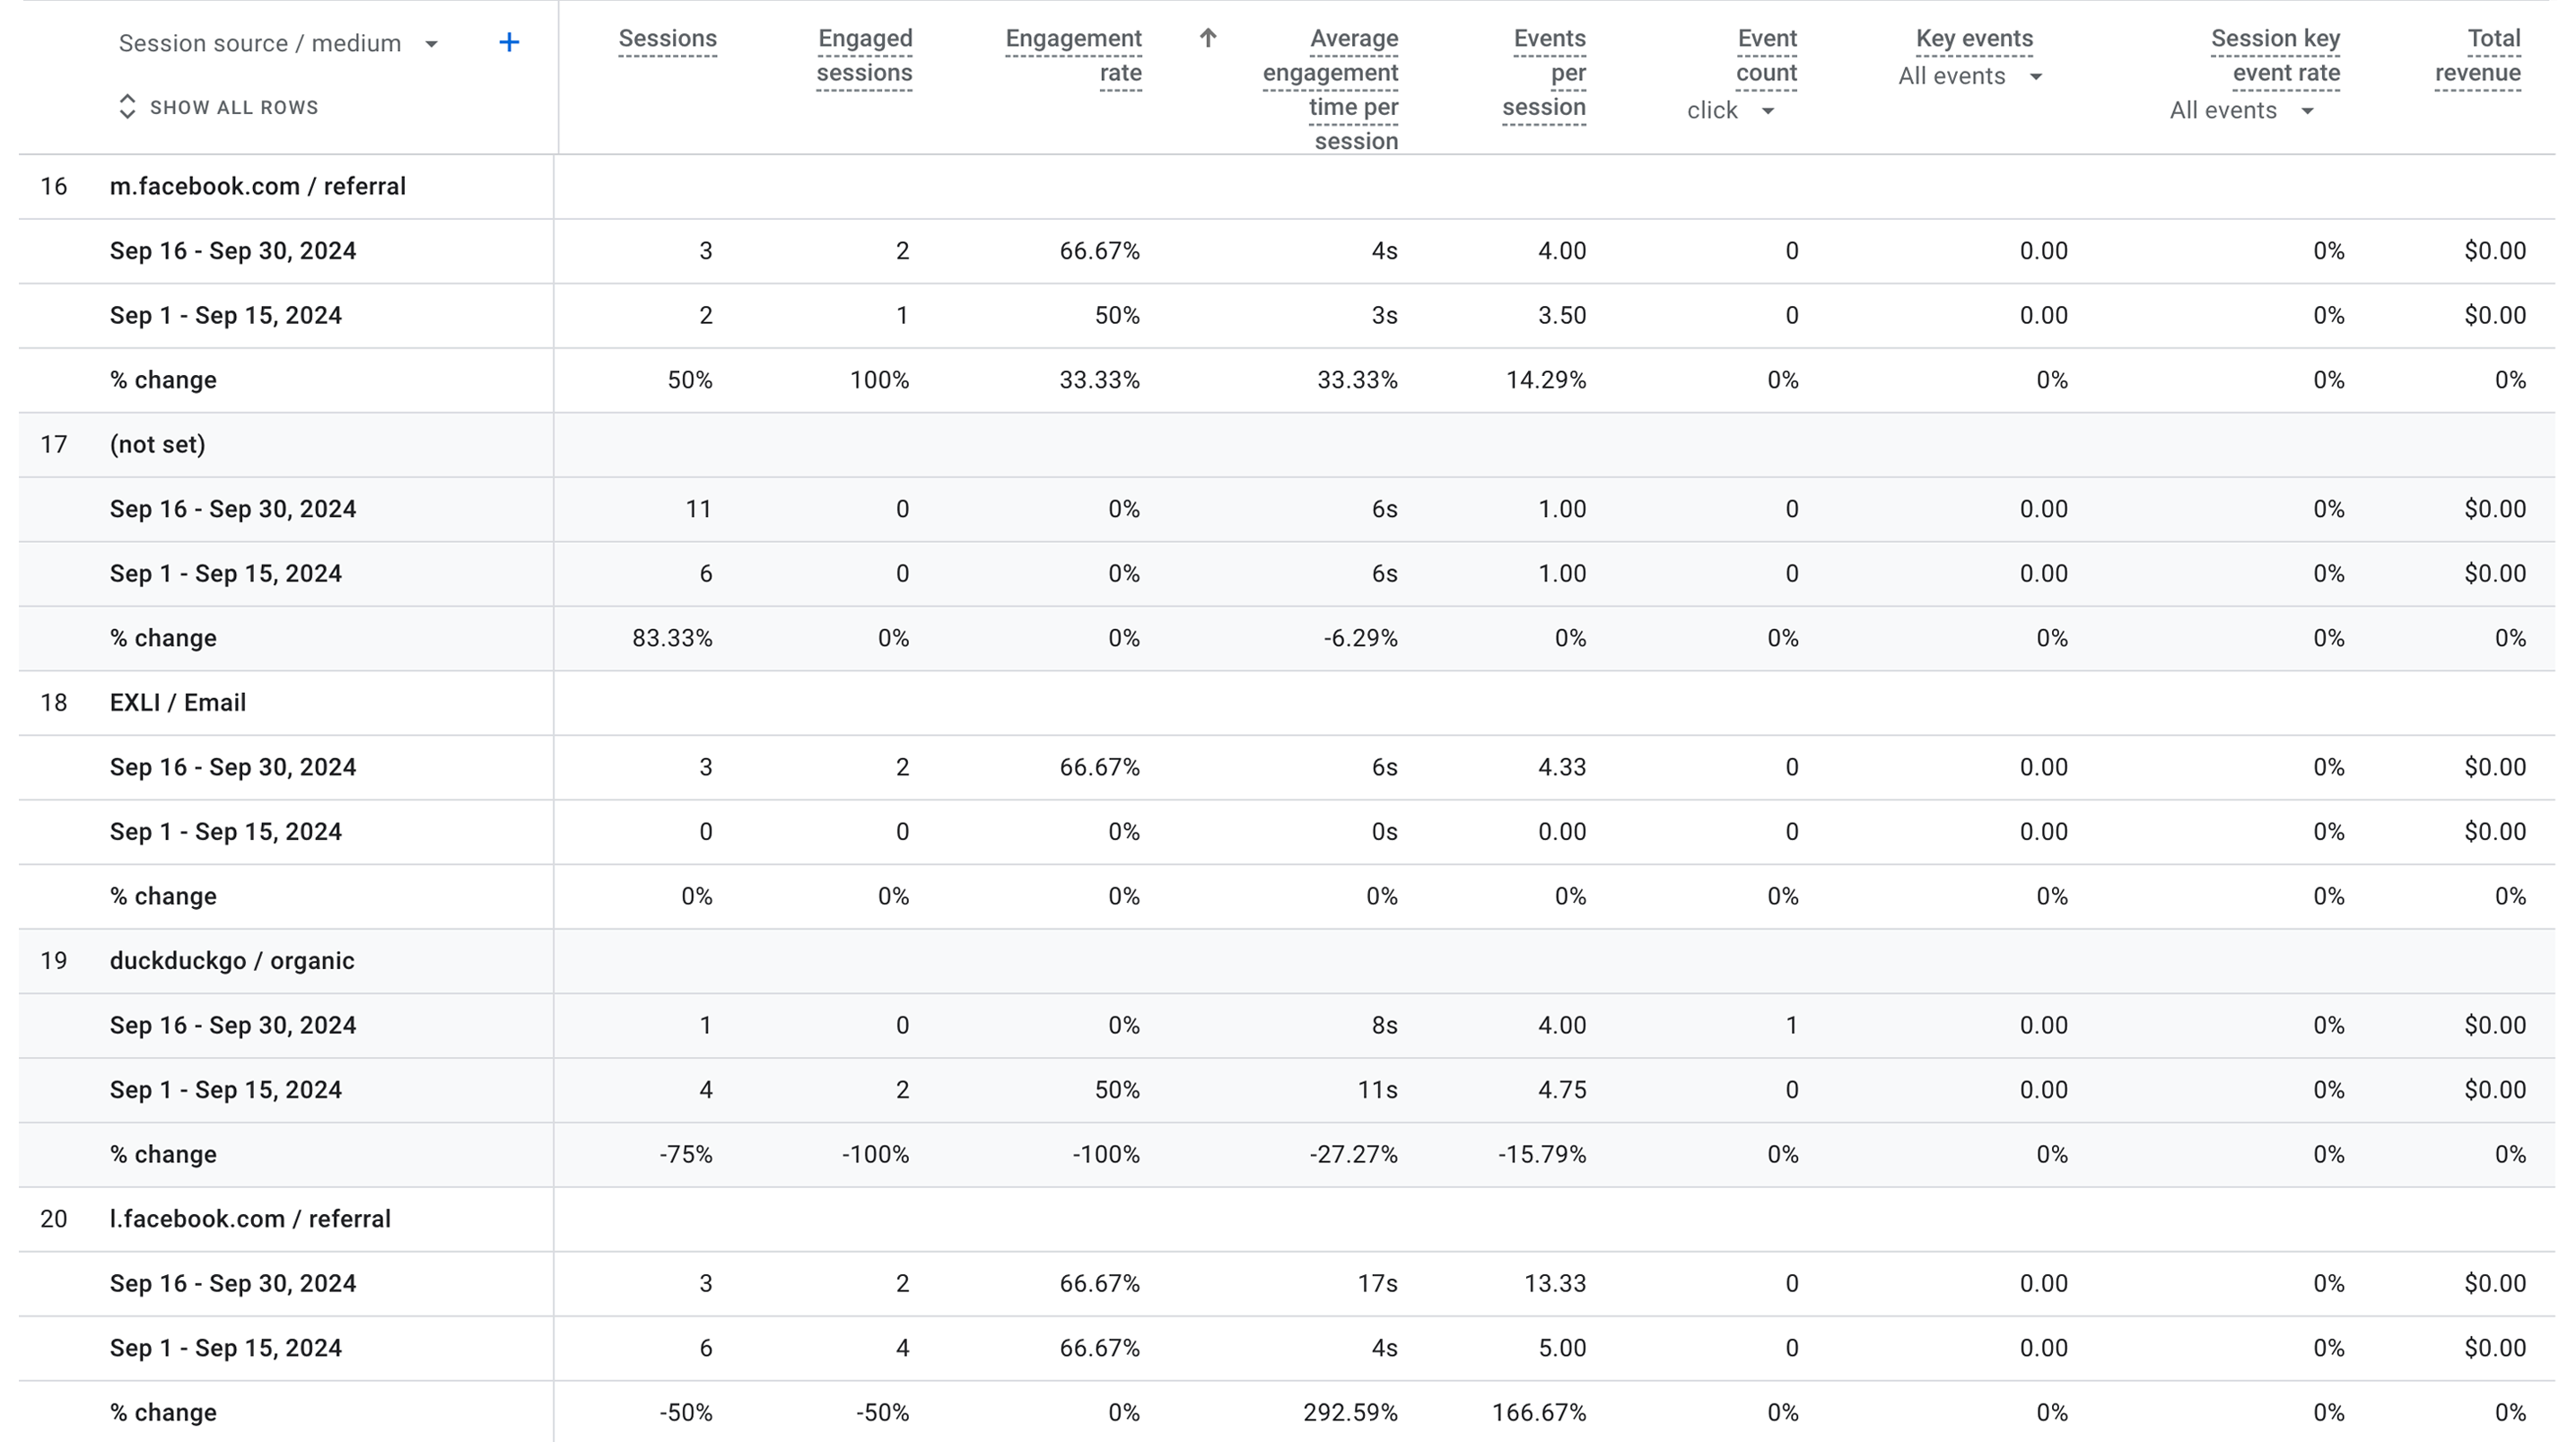
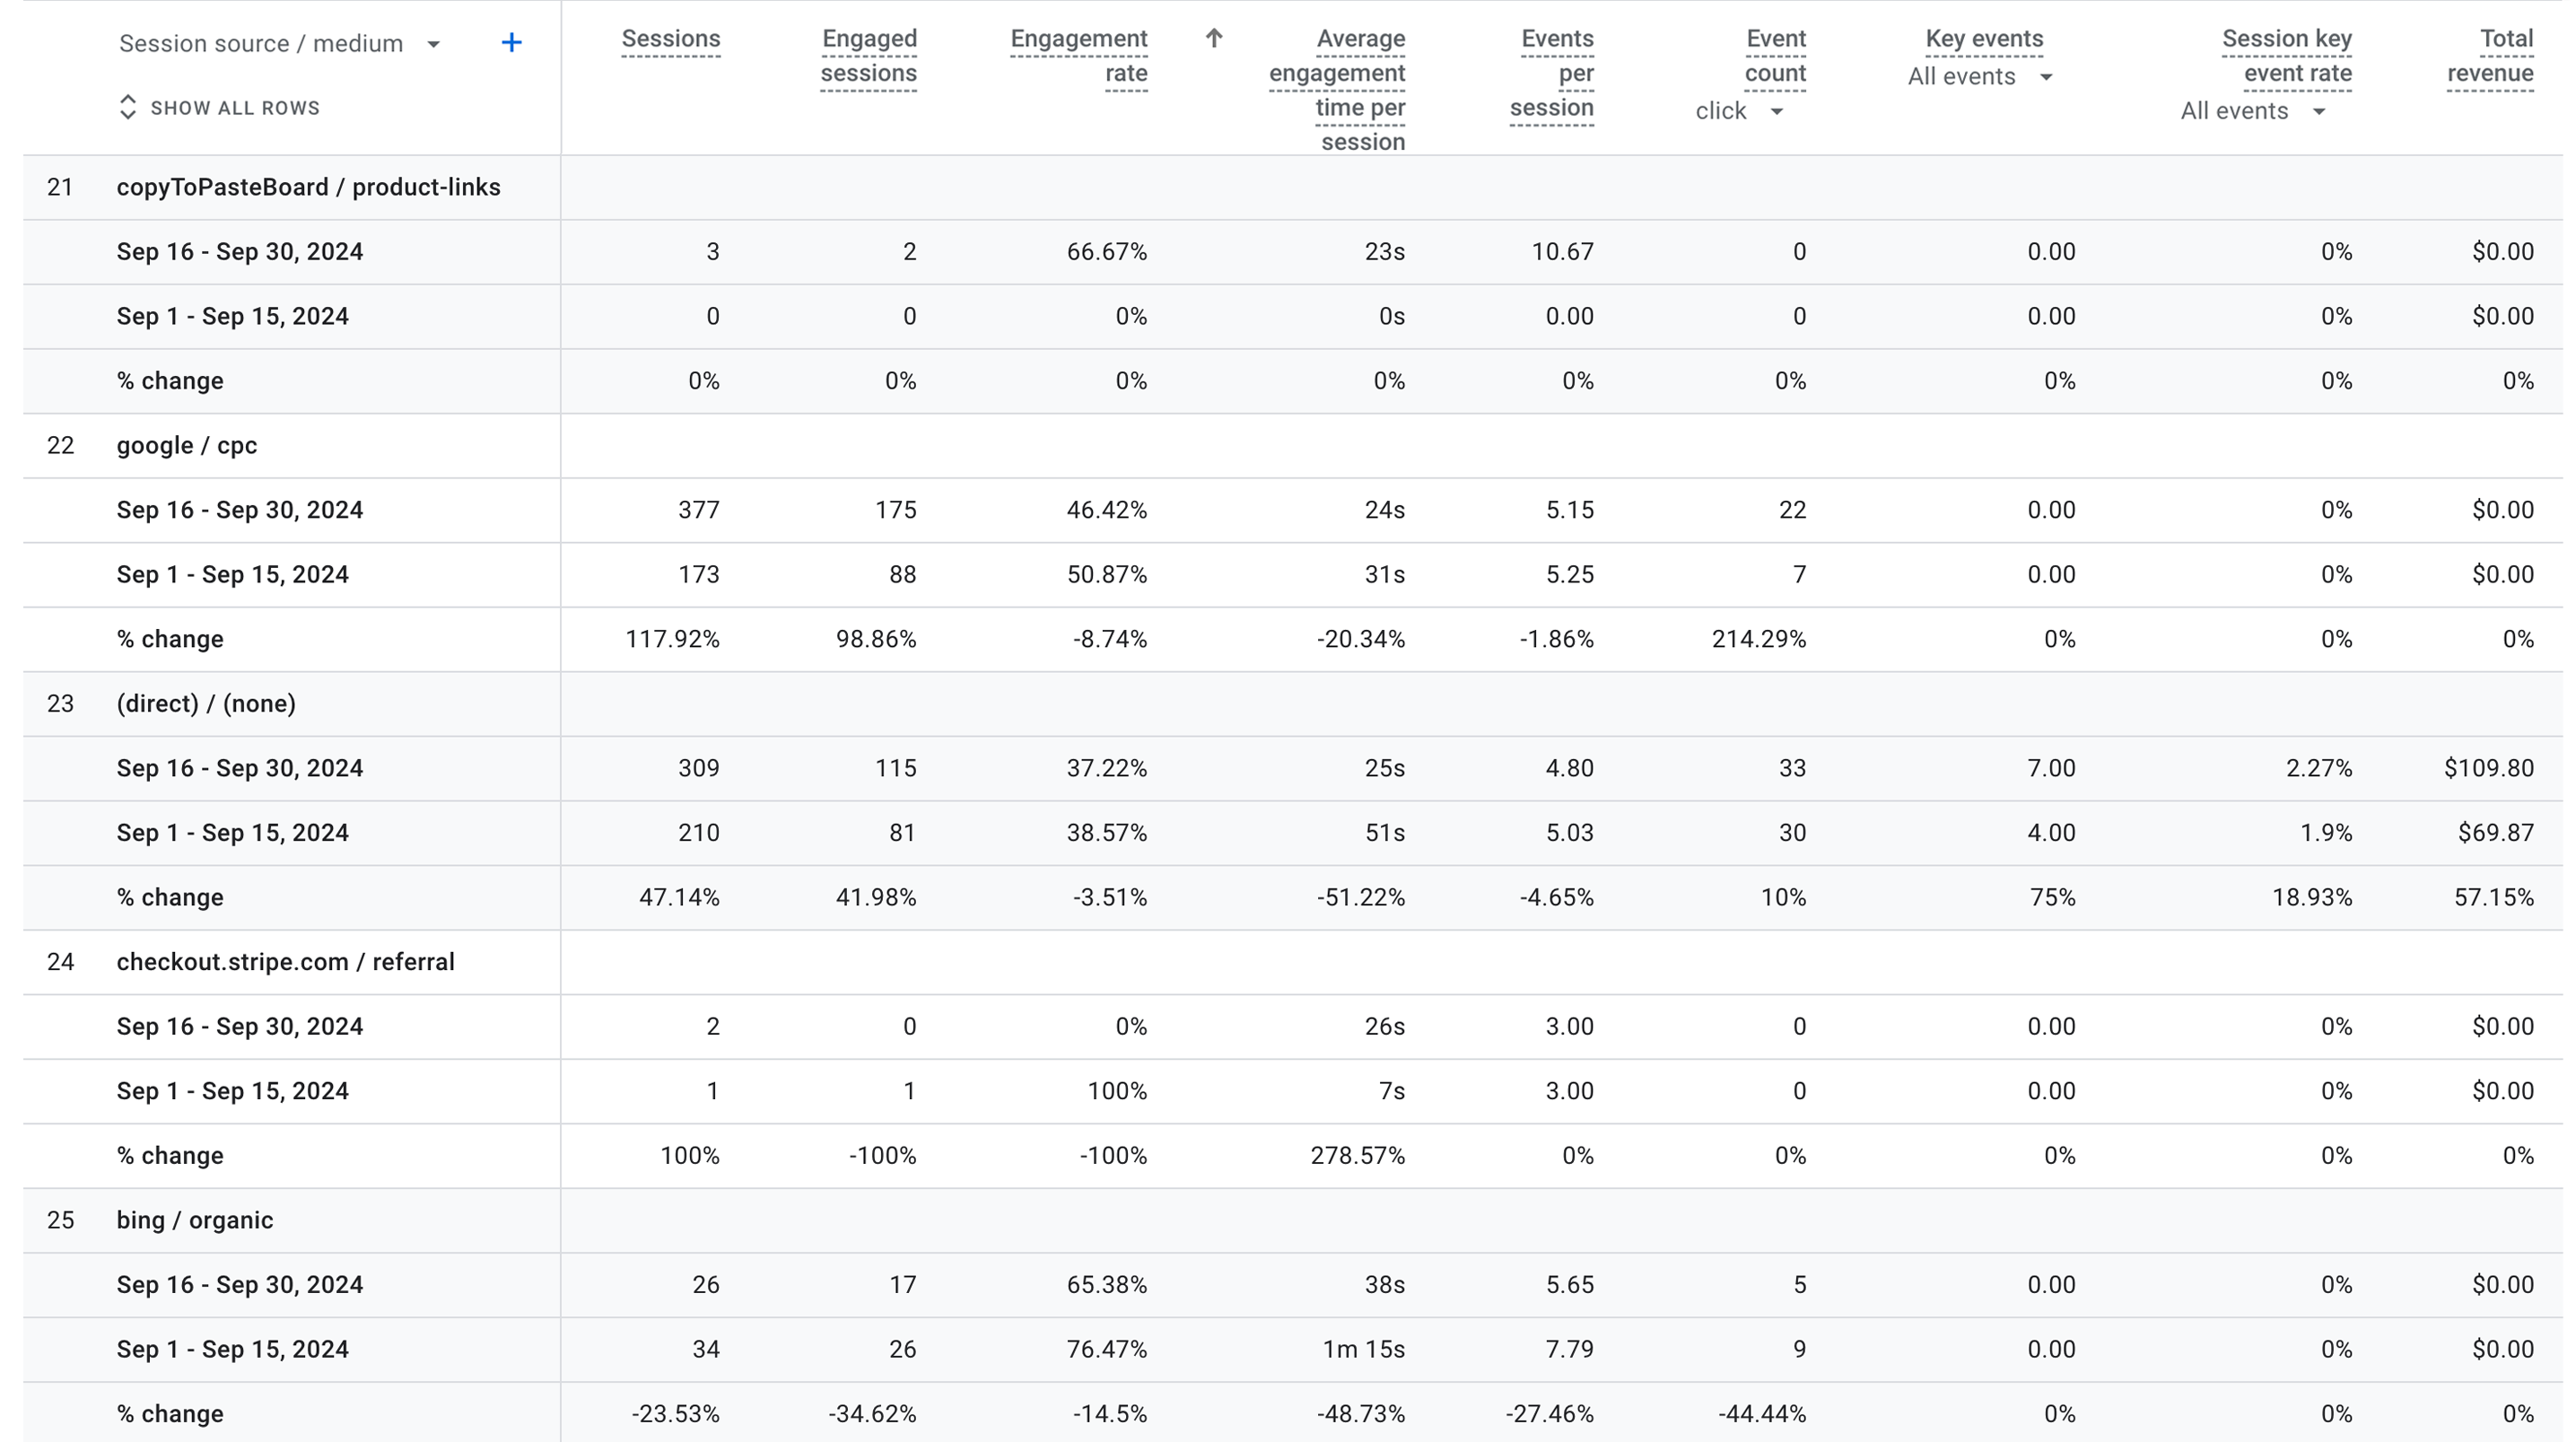
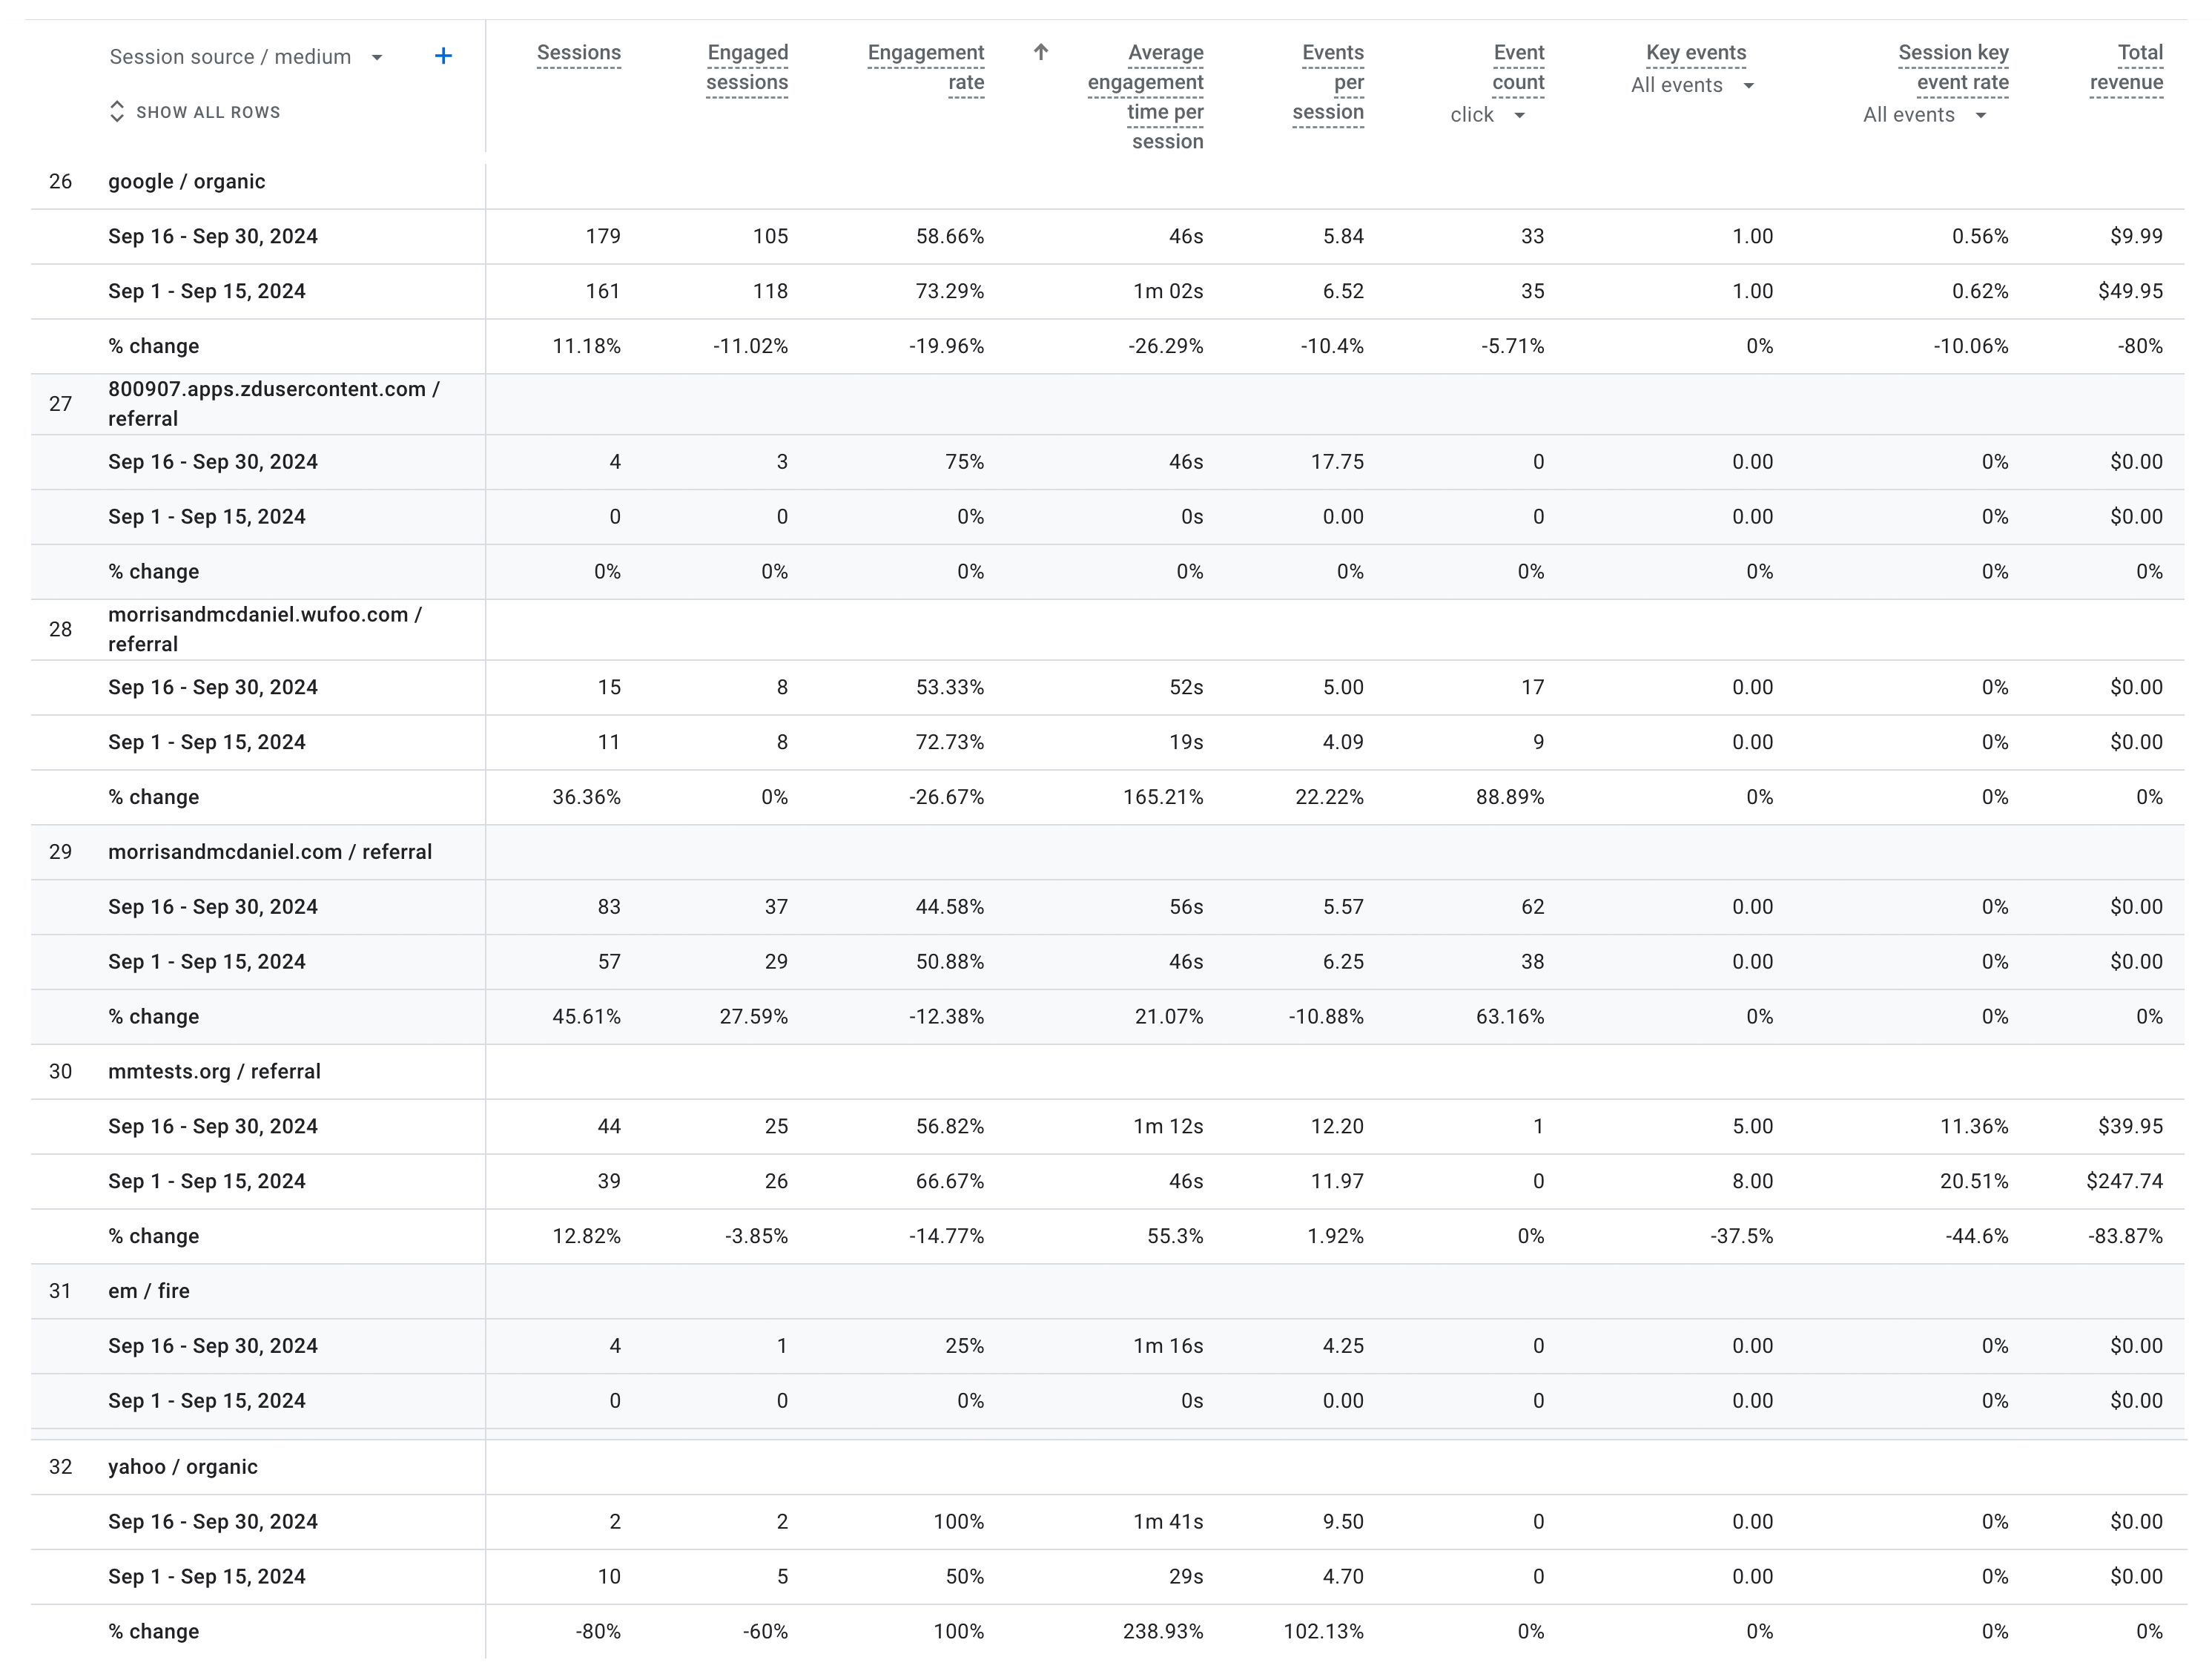
Source/Medium
Below is more detail on where the website traffic is coming from. EXFB is Facebook ads and LI is LinkedIn.
